

In every aspect of our lives, when we see bargains in merchandise we love, we buy more.
As consumers, we get excited to capture a sale, but as investors, we run from sales.
Flip this narrative around and we become great investors.
Key Points
- Short-termism is rampant in the equity markets & hurts portfolio performance.
- 100 years of returns prove, buying equities after tough years is a wonderful decision.
- Leading consumer brands have performed well in 2023 but there’s plenty left in the tank.
Making short-term decisions for a long-term investment portfolio creates underperformance.
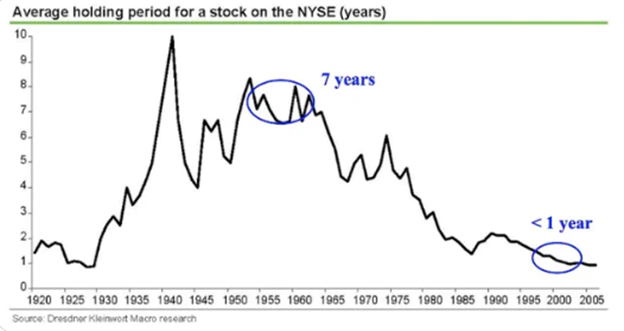
Lots of investors made long-term investment decisions based on major outlier events that occurred in 2022. Sentiment is one of the least talked about and most important drivers of attractive long-term returns. Very few people would have guessed the market would look the way it does today. We know with certainty that it’s “time in the market” versus “timing the market” that drives successful investment outcomes. Sadly, short termism is rampant in markets today. As the chart below shows, the average holding period for a stock on the NYSE is now down to 1 year versus 7 years in the 1950’s and 1960’s. The same information is true of holding periods for ETF’s and active funds. Retail and professional investors simply do not have much patience anymore. We want high returns and muted volatility NOW and forever. Side bar: the best potential to reach higher returns with muted volatility is by investing in private markets, which is why we are so bullish about the industry’s growth and the titans of that industry, Blackstone, KKR, and Apollo.
Reacting to short-term volatility & news tends to help drive poor financial decisions that often do not have anything to do with an actual company’s business operations. The best recipe for investment success: buy and hold great businesses, ETFs, and/or active funds and add to them when markets are down. When markets are oversold, sentiment is dreadful, and valuations are low, consider swapping some “safety exposure” to take more risk. Do the opposite when valuations are high and unsustainable, and sentiment is unrealistically bullish. Today, sentiment is at multi-decade lows and the appetite for equities is still quite muted.
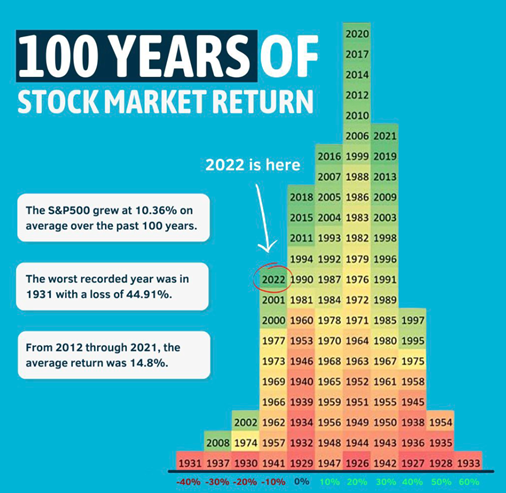
100 Years of Market Returns by Performance Blocks.
The chart below, from finance site marktalksmoney.com highlights annual index performance by return decile. Average annual returns for the broad market over the last 100 years was 10.36%, so this level can serve as a “base case” long term. Ironically, very rarely does the market have a 10% return year, the performance tends to be much more or much less than 10%. The market generally offers positive returns about 84% of the time yet we always seem to find things to worry about, and the worry leads us to be less exposed than we should be. Worry also keeps us from buying more shares when sales happen. If you take one datapoint from my weekly notes, please remember that the gods are giving you a gift when great companies go on sale like they did in 2022. Use the short-term weakness that comes over time to add to your positions, you’ll thank me when you need your money in retirement.
Let’s look at a few examples of poor investment years and the subsequent returns to see if we can spot some patterns.
- 2022: the S&P 500 was -18.1% and the Nasdaq 100 Index was -32.5%
2023 YTD through August 30: the S&P 500 is +17% and the Nasdaq 100 is +40%.
In 2022, we all experienced a 100-year storm of multi-decade high inflation and rapidly normalizing interest rates. These are outlier events relative to history and not to be relied upon for making long-term investment decisions in our view. The sales of 2022 were for buying as we have discussed many times in these notes. The YTD return of great businesses in 2023 is the proof-point.
- 2018: the S&P 500 was -4.5% and the Nasdaq 100 Index was -0.12%
2019: the S&P 500 was +31.2% and the Nasdaq 100 Index was +38.9%
- 2011: the S&P 500 was +1.9% and the Nasdaq 100 Index was +3.3%
2012: the S&P 500 was +16% and the Nasdaq 100 Index was +18%
- 2008: the S&P 500 was -36.8% and the Nasdaq 100 Index was -41.7%
2009: the S&P 500 was +26.3% and the Nasdaq 100 Index was +54.7%
Lots of Great Brands are Still Attractively Priced after 2022.
2023 has seen a big resurgence after a dismal 2022 but the returns YTD are still heavily skewed towards a smaller handful of Magnificent 7 brands like Amazon, Apple, Google, Meta, Nvidia, Microsoft, and Tesla. Covid and the distortions created by it continue to hold some industries back from reaching 2019 levels. That’s the opportunity for investors today. As the economy continues to heal and business trends and consumer spending trends get back to “typical”, wonderful opportunities will continue to present themselves.
My investing rule: If stocks in general, over the long-term, generate 8-10% annual returns, the most relevant companies, with the best long-term growth opportunities serving large end-markets should compound well above this base rate. The history of the most iconic and relevant brands proves this out but you have to stay engaged in difficult times to receive the benefit. Consider these stats since each Mega Brand became a public company and as of 8/30/2023 (just a random list of current holdings and relevant brands today):
Amazon annualized return since 1997: +32.9% versus 8.4% for the S&P 500 Index.
Nike annualized since 1980: +16.5% versus 10% for the S&P 500.
Lululemon annualized since 2007: +22.4% versus 8.9% for the S&P 500.
Netflix annualized since 2002: +31.6% versus 9% for the S&P 500.
Apple annualized since 1980: +20.5% versus 10% for the S&P 500.
Live Nation annualized since 2005: +12.1% versus 9.5% for the S&P 500.
Deckers Outdoors annualized since 1993: +15.3% versus 9.9% for the S&P 500.
Costco annualized since 1985: +13.5% versus 10% for the S&P 500.
Importantly, all of these stocks have experienced multiple 20% drawdowns (some >50% drawdowns) along the way to the stellar returns above. Great companies that stay highly relevant, tend to perform well over time and are raging buying opportunities when on sale. If you remember this statement, you will be a very successful investor.
Bottom line:
If investors have time on their side, each soft patch in great stocks is a wonderful opportunity to build greater exposure. More exposure to great companies on sale, ultimately leads to more assets at the end of the investment life cycle.
One of our favorite brands today:

Since going public in 1997, AMZN stock has annualized 4x the S&P 500.
The company has never been more relevant and has never had the opportunity-set it does today after a historic investment cycle.
Amazon’s 3-year annualized return ending August 30, 2023: -7.8% vs +9.8% for the S&P 500.
Amazon’s 5-year annualized return for the same end-date: +6.6% vs +10.8% for the S&P 500.
Either something is very broken at Amazon, we vehemently disagree, or Amazon likely delivers an outsized return going forward. That’s our bet & mean reversion is a powerful phenomenon.
Disclosure: The above report is a hypothetical illustration of the benefits of using a 3-pronged approach to portfolio management. The data is for illustrative purposes only and hindsight is a key driver of the analysis. The illustration is simply meant to highlight the potential value of building a consumption focused core portfolio using leading companies (brands) as the proxy investment for the consumption theme. This information was produced by Accuvest and the opinions expressed are those of the author as of the date of writing and are subject to change. Any research is based on the author’s proprietary research and analysis of global markets and investing. The information and/or analysis presented have been compiled or arrived at from sources believed to be reliable, however the author does not make any representation as their accuracy or completeness and does not accept liability for any loss arising from the use hereof. Some internally generated information may be considered theoretical in nature and is subject to inherent limitations associated therein. There are no material changes to the conditions, objectives or investment strategies of the model portfolios for the period portrayed. Any sectors or allocations referenced may or may not be represented in portfolios managed by the author, and do not represent all of the securities purchased, sold or recommended for client accounts. The reader should not assume that any investments in sectors and markets identified or described were or will be profitable. Investing entails risks, including possible loss of principal. The use of tools cannot guarantee performance. The charts depicted within this presentation are for illustrative purposes only and are not indicative of future performance. Past performance is no guarantee of future results.