


Do You Have Sufficient Diversification Away from Today’s Most Crowded Trades?
Key Summary:
- The market is incredibly crowded with Tech & Communication Services exposures today.
- A typical portfolio now contains much more concentration risk & without proper diversification.
- An inspection of the Large Blend and Large Growth indices highlights diversification opportunities.
Very Important thesis: If equities generate roughly 8-10% a year over time, leading brands serving the dominant driver of the economy, in theory, should compound at 10-15%+ over time. We have significant proof on this topic. In a world where rates and inflation are higher than we might like, business models with pricing power, exposure to quality factors, and that generate strong profits and free cash are set up to win versus the typical peer. Brands Matter.
It’s Time for a Holdings-Based Analysis of Your Equity Portfolio.
Today, it’s important to see a holistic view of your equity portfolio to make sure there aren’t hidden, excess risks. In a world where money flows go to more passive investments that are primarily market cap weighted, there is more capital tied to the momentum and tech style factors than ever before. The longer the period one gets rewarded, the less risky we feel the investment becomes. Risk happens slowly and then all at once. I worked for a great value manager in the late 1990’s and remember the difficulties keeping up with the bifurcated market that looks eerily like our market today. I also remember having strong performance when tech began its multi-year period of underperformance as “everything else” began to play catch-up.
As I look at the action in technology and semiconductors, I cannot help but compare the love for the sector today with the love for it during the late 1990’s. Yes, things are very different today, and back then, it was highly speculative, profitless companies driving the bullish narrative while today, massive profitability and high-quality balance sheets are where the bulk of the euphoria is. I have no problem with mega cap, high quality tech and semiconductors, to be clear. My concern today, is the excess-exposure most portfolios have to the tech and growth stocks that have punched well above their weight relative to long-term averages. Remember, the S&P 500 has compounded at roughly 9-10% per year over the last 100 years. The S&P 500, over the last 5 years, has annualized at 14.8%. The Tech sector has annualized at ~24% and the semiconductor industry at ~37%. It’s either different this time or the S&P 500, with its 40% tech/comm services weight and the Russell 1000 Growth Index with its ~60% are punching well above their weight and due for some mean reversion as everything else plays a bit of catch-up.
A Look Deeper Inside the S&P 500 (Large Blend) and Large Cap Growth Style Portfolios.
If one had to categorize how our team manages money, it would be as a “flexible, global-oriented, growth at a reasonable price” investor. We are agnostic with regards to sector, industry and other style factors but our primary focus is on the major thematic of “global household spending.” As a dedicated investor in this theme, our typical overweight position is diametrically opposed to the indices because we are always over-indexed to the Consumer Discretionary sector not the tech sector. The Consumer Discretionary & Staples sector is heavily under-owned by retail and institutional investors. In fact, it’s as under-owned as I’ve ever seen it be. That makes me excited. When a sector or thematic has a history of strong performance and it goes through a shorter period of lagging performance while investors abandon it, the forward returns have tended to be above the long-term average.
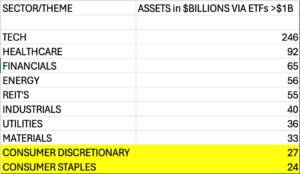
How under-owned are consumer stocks and over-owned are tech stocks? Just looking at the sector ETF’s with >$1B of assets, there’s roughly, $247B in total Technology assets versus about $27B in Consumer Discretionary assets and about $24B in Consumer Staples assets. So tech now accounts for over 9x more assets than Consumer Discretionary yet household consumption accounts for 70% of GDP. FYI, when I did this analysis 3 years ago, the number was about 4x, so the delta in assets between the two is now much more extreme. The chart below shows the total assets across major sectors using $1B AUM the starting point. When I say, “the consumer sectors are under-owned and unloved”, I mean it’s at extremes I haven’t ever seen. When the S&P 500 weight to consumer sectors is ~15% and the Russell 1000 Growth Index is ~17%, you see how in a passive and benchmark hugging world how certain sectors get under-owned. To us, that spells a lot of opportunity for returns and also diversification benefits for investors.
It’s above my paygrade to know when the investment community will turn its attention to other sectors and themes outside of technology, but I suspect we will need to see some relative 1-year outperformance to get peoples attention. At the very least, carving off a bit of blend (core) and growth exposure to ETF’s and funds with a heavy overweight to Tech and Communication Services to get some important diversification in more reasonably valued and unloved areas could be a very prudent decision today. There can be real benefits to adding strategies that look very different than the major indices.
Large Blend and Large Growth are the Two Largest Allocation Weights in Most Portfolios.
We know through analyzing money flows, the large blend and large growth style boxes are where the flows have been for many years. The underperformance in value, small-cap, and non-U.S. has simply driven more money into fewer styles. Most portfolios today are simply too exposed to technology and at a time when valuations are certainly stretched in general. The numbers do not lie. There’s an estimated $15 Trillion benchmarked to the S&P 500, largely with similar weights to the largest sector Technology today(40%+). There’s an additional roughly $1.5 Trillion benchmarked to the Large Cap Growth style box with very heavy weights to tech, plus an additional 10-15% weight in Communication Services. Add to this the high-tech exposure across all other “growth style boxes” and we are talking about almost $20 Trillion in assets with as high a weighting to high beta Tech as the markets have ever seen.
Perhaps carving off a bit of exposure to the most expensive and crowded parts of the market is not only smart but prudent? We certainly think some added exposure to the consumer, globally, is logical given household spending is 60% of world GDP and a $50+ trillion annual theme. The fact that it’s the most unloved part of the market just means it could be the beneficiary of a wicked mean reversion opportunity as too much money overwhelms a much smaller asset class.
Disclosure: The above data is for illustrative purposes only. This information was produced by Accuvest and the opinions expressed are those of the author as of the date of writing and are subject to change. Any research is based on the author’s proprietary research and analysis of global markets and investing. The information and/or analysis presented have been compiled or arrived at from sources believed to be reliable, however the author does not make any representation as their accuracy or completeness and does not accept liability for any loss arising from the use hereof. Some internally generated information may be considered theoretical in nature and is subject to inherent limitations associated therein. There are no material changes to the conditions, objectives or investment strategies of the model portfolios for the period portrayed. Any sectors or allocations referenced may or may not be represented in portfolios managed by the author, and do not represent all of the securities purchased, sold or recommended for client accounts. The reader should not assume that any investments in sectors and markets identified or described were or will be profitable. Investing entails risks, including possible loss of principal. The use of tools cannot guarantee performance. The charts depicted within this presentation are for illustrative purposes only and are not indicative of future performance. Past performance is no guarantee of future results.