Key Summary:
- There is no other broad market theme bigger than global consumer spending.
- The easiest and most defendable allocation decision is to add consumer exposure.
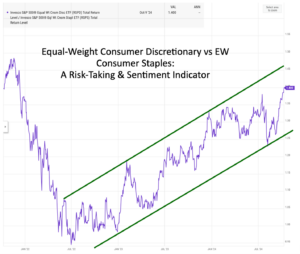
- The equal-weight Consumer Discretionary basket continues to outperform Staples.
Very Important thesis: If equities generate roughly ~10% a year over time, leading brands, dominant global franchises, particularly those serving the dominant driver of the economy, in theory, should compound at 13-15%+ over time. In a world where rates and inflation will likely trend higher for longer, business models with pricing power, exposure to quality factors, and that generate strong profits and free cash are set up to win versus broad markets. Brands Matter.
Don’t Ignore a $50+ Trillion Theme in Your Portfolio.
The U.S. is a roughly $28 trillion economy and a leader in innovation across sectors. Thank heavens the bulk of our portfolio is tied to the #1 economy in the world. Whether we realize it or not, our investment decisions and our home bias make us reliant on the U.S. economy. Staying up to speed on the core driver of the economy is a very important factor when managing U.S.-centric portfolios. Holding one or a few dedicated investments in this theme makes that easier. As I’ve written many times, our economy is consumer-spending focused. Spending on needs and wants is in our DNA which makes investing in this theme not only logical but highly profitable. One belief I have stated over and over: If the S&P 500 returns about 10% long-term, the best companies, the dominant franchises operating across important industries should compound greater than the market overall. It’s these companies where our team focuses 100% of our time. I used the +13-15% annual returns as an internal benchmark for leading brands over full market cycles. This is what we should expect and what the data has shown long-term.
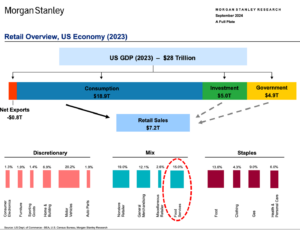
The chart below simplifies the opportunity for investors by showing how important the consumption component of GDP is in America. Retail Sales alone is about $7 trillion a year. Consumers spend across a variety of “needs” categories as well as “wants” categories. We invest in leading brands across both needs and wants. Additionally, we are a service economy so roughly two-thirds of GDP comes from services and small businesses. Fun fact, household consumption drives every major economy making a global brands allocation an easy core equity choice for allocators. The consumption in the U.S. accounts for about $18.9 trillion per Morgan Stanley and it grows 2-3% each year with alarming predictability. Even a global pandemic cannot stop us consuming for very long. Just to put an exclamation point on this statement, very few investors have sufficient exposure to the brands dominating across important consumption categories. ETF’s are under-exposed, active funds are under-exposed, and retail investors who chase momentum in tech are wildly under-exposed to iconic consumer brands. That’s the opportunity. Adding important exposure to stocks that are superior operators, have global sales opportunities, and have stellar long-term track records is an easy decision.

Market Health Update: Discretionary is Outperforming Staples (defensives).
Most investors invest in sectors via ETF’s and funds. It’s important to compare the major ETF’s and market cap weighted strategies with equal-weighted strategies because sometimes, the most popular ETF does not tell the whole story in a sector. Monitoring the equal-weighted indices across discretionary & staples is vital to understanding the strength or weakness underlying the real economy. Remember, having this knowledge will help you across all the investments you hold given how reliant everything is to our economy.
The discretionary sector struggled as did all growth and quality-oriented areas of the market in 2022. That was a classic re-set and a raging opportunity to add exposure. About mid-year 2022, something happened, discretionary stocks vs staples stopped underperforming and began to outperform. This tends to happen after big market dislocations, beta begins to outperform low vol. The chart below shows a ratio chart of the equal-weight discretionary vs staples performance. When the line is rising, discretionary stocks are outperforming defensives. The rising line highlights the markets appetite for risk-taking and the overall health of the economy. For now, it’s clearly saying more positive things than you might hear from the media.

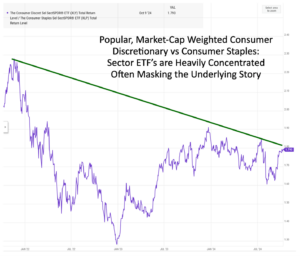
Market-Cap Weighted Investments Are Masking Underlying Strength.
Important: most assets across all sectors and index investments are invested in market-cap weighted strategies. That’s been helpful at the index level and has led investors astray when analyzing the consumer stocks. Here’s how the market-cap weighted sector strategies look vs the bullish equal-weighted ones. The chart shows discretionary stocks still under a downtrend but threatening to break over the downtrend.
If I saw this chart and it was a stock, I would say the direction is inconclusive until a clean break of the downtrend line has been accomplished. Clearly, this chart tells a different story than the one above which screams, offense over defense generally across consumer stocks. Both are performing but one is performing better than the other.

SUMMARY:
The over-arching message these ratio charts are telling us: broadly, the consumer stocks are performing better than defensive staples which remains a bullish sign for the U.S. economy and therefore equity markets today. And remember, algorithms and zero-days to expiration index options drive daily market volume so if you are engaged in equities, you must absorb the daily volatility they create. We like to use this volatility to our advantage with fast-twitch active trading when we see the opportunity, which offers a unique and differentiated edge in today’s volatile world.
A reminder about our approach: 1) Offense (discretionary, tech, communication services, and alternative asset managers), 2) Defense (staples, healthcare, holding excess cash), and 3) Special teams (active, fast-twitch trading which can offer multiple years of a company dividend in less than 30 days of risk exposure when executed properly).
Disclosure: The above data is for illustrative purposes only. This information was produced by Accuvest and the opinions expressed are those of the author as of the date of writing and are subject to change. Any research is based on the author’s proprietary research and analysis of global markets and investing. The information and/or analysis presented have been compiled or arrived at from sources believed to be reliable, however the author does not make any representation as their accuracy or completeness and does not accept liability for any loss arising from the use hereof. Some internally generated information may be considered theoretical in nature and is subject to inherent limitations associated therein. There are no material changes to the conditions, objectives or investment strategies of the model portfolios for the period portrayed. Any sectors or allocations referenced may or may not be represented in portfolios managed by the author, and do not represent all of the securities purchased, sold or recommended for client accounts. The reader should not assume that any investments in sectors and markets identified or described were or will be profitable. Investing entails risks, including possible loss of principal. The use of tools cannot guarantee performance. The charts depicted within this presentation are for illustrative purposes only and are not indicative of future performance. Past performance is no guarantee of future results.

