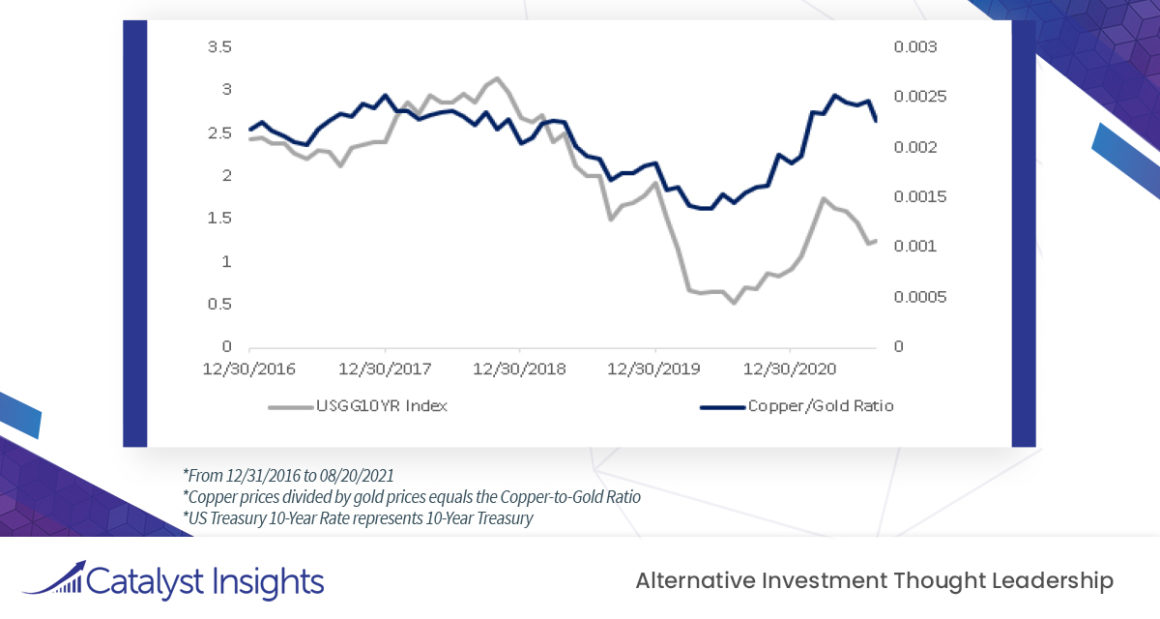
Chart of the Week: Copper/Gold Ratio vs 10-Year Treasury

Chart of the Week | August 23, 2021
Macro Insights

Copper/Gold Ratio vs 10-Year Treasury

  • In the wake of the commodity supercycle and the new infrastructure deal, commodities remain supported by a robust thematic environment.
  • Copper is more volatile than gold, but the Copper to Gold Ratio historically correlates to the 10-Year US Treasury Rate.
  • The Copper to Gold Ratio is historically a leading indicator for interest rates as they both track macro sentiment. Based on the current relationship, this dynamic looks to be either going through a regime shift or forecasting a sharp increase in yields as the economy recovers and vaccinations continue.
[vc_btn title=”Download this Chart of the Week” color=”primary” link=”url:https%3A%2F%2Fcatalyst-insights.com%2Fwp-content%2Fuploads%2F2021%2F08%2FCI_ChartOfTheWeek_8-23-21.pdf||target:%20_blank|”]

Latest

Navigating the Rate Cut: A Guide for Advisors

Introduction The ongoing Federal Reserve cycle has sparked intense debate...

My 50-Cents – Fed Analysis from Leland Abrams of Wynkoop, LLC

The Federal Reserve Board cut their benchmark rate this...

A Summer Surge: August 2024 HANDLS Monthly Report

After a challenging July that saw investors sell off high-flying technology stocks, buyers returned to the market in August, bidding up risk assets across the board.

Where are the Hidden Risks in Your Portfolio Currently? Plus, an idea.

Allocators add new exposures for a variety of reasons; diversification, returns, risk mitigation, etc. Understanding this, what is the most over-owned and expensive sector today?

Newsletter

Don't miss

Navigating the Rate Cut: A Guide for Advisors

Introduction The ongoing Federal Reserve cycle has sparked intense debate...

My 50-Cents – Fed Analysis from Leland Abrams of Wynkoop, LLC

The Federal Reserve Board cut their benchmark rate this...

A Summer Surge: August 2024 HANDLS Monthly Report

After a challenging July that saw investors sell off high-flying technology stocks, buyers returned to the market in August, bidding up risk assets across the board.

Where are the Hidden Risks in Your Portfolio Currently? Plus, an idea.

Allocators add new exposures for a variety of reasons; diversification, returns, risk mitigation, etc. Understanding this, what is the most over-owned and expensive sector today?

Consumer Spending: Are Consumers Tapped Out or Pushing Back?

Consumer Spending: Are Consumers Tapped Out or Pushing Back?  Key...
Hunter Frey, Analyst
Hunter Frey is an Analyst at Catalyst Capital Advisors, LLC and Rational Advisors Inc. covering all in-house equity strategies and an insider buying income-oriented strategy at Catalyst Funds. Mr. Frey received a Bachelor of Science degree in International Business with a focus in Spanish from Gardner-Webb University, Godbold School of Business, and is in pursuit of a Master of Business Administration in Economics and Finance from New York University, Stern School of Business.

Navigating the Rate Cut: A Guide for Advisors

Introduction The ongoing Federal Reserve cycle has sparked intense debate regarding its resemblance to the 2007 and 1998 financial crises. While a definitive answer remains...

My 50-Cents – Fed Analysis from Leland Abrams of Wynkoop, LLC

The Federal Reserve Board cut their benchmark rate this week by 50 bps to a new range of 4.75% - 5.00%.  They indicated this...

A Summer Surge: August 2024 HANDLS Monthly Report

After a challenging July that saw investors sell off high-flying technology stocks, buyers returned to the market in August, bidding up risk assets across the board.