[vc_row][vc_column][vc_column_text]
Chart of the Week | September 13, 2021
Macro Insights
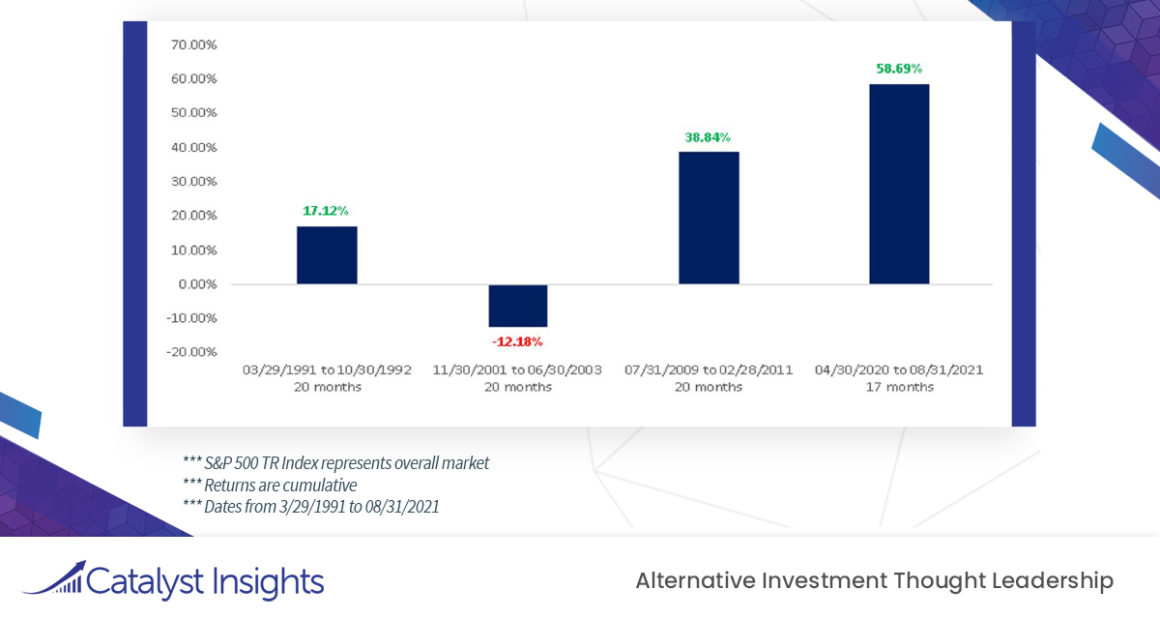
[/vc_column_text][vc_column_text]20 Month Performance of the S&P 500 TR Index After a Recession
- The current recovery outshines the previous three recoveries from a cumulative return standpoint.
- The cyclical and more elastic sectors remain key drivers to this outperformance during the beginning stages of the business cycles.
- During this current economic recovery, small caps, value, and cyclicals remain the bright spots during this current environment.
[/vc_column_text][vc_btn title=”Download this Chart of the Week” color=”primary” link=”url:https%3A%2F%2Fcatalyst-insights.com%2Fwp-content%2Fuploads%2F2021%2F09%2FCI_ChartOfTheWeek_9-13-21.pdf||target:%20_blank|”][/vc_column][/vc_row][vc_row][vc_column][vc_raw_html]JTNDc3R5bGUlM0UlMEEucGFnZS1oZWFkZXIlN0IlMEFkaXNwbGF5JTNBbm9uZSUyMWltcG9ydGFudCUzQiUwQSU3RCUwQSUwQSUzQyUyRnN0eWxlJTNF[/vc_raw_html][/vc_column][/vc_row]