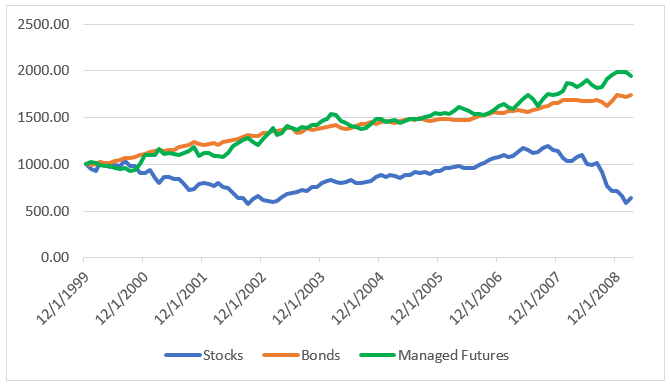
The beginning of the 21st century in investing has witnessed two significant market crashes, including the tech bubble crash and the Great Financial Crisis in 2008. It should surprise no one that up until March 2009, managed futures trounced the returns of both stocks and bonds (see chart below).
Managed Futures vs. Stocks and Bond 2000 – March 2009

Source: Bloomberg
Since the bottom of the equity markets in 2009 though, returns from managed futures have annualized roughly 6% below that of the prior period. Nearly half of the decline can be traced to a simple explanation: managed futures funds make much less on their cash reserves since short-term rates have stayed so low, especially in comparison to the previous, three-month Treasury bills, which annualized approximately 2.5% less.
So, what’s the solution? I believe that putting cash in managed futures funds to work is the answer. Managed futures funds only need a slice of capital to use for the actual managed futures strategy.
Let’s look at two different ideas of investments, each with a relatively small sliver of risk dedicated to the managed futures portion:
- An alternative equity investment that holds 60% of assets in the S&P 500; and
- An alternative bond investment that holds 70% of assets in the Bloomberg Barclays U.S. Aggregate Index.
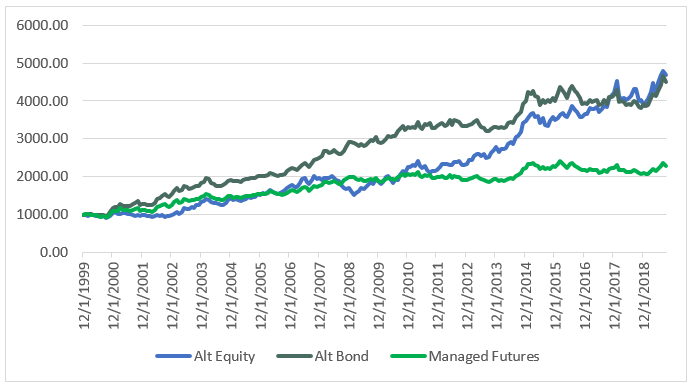
The return profile improves dramatically from stand-alone managed futures as the chart below illustrates.
Alternative Equity vs Alternative Bond vs. Stand-Alone Managed Futures

Source: Bloomberg
| 2000-Present | Alt Equity | Alt Bond | Stand-Alone |
| Annualized Return | 8.1% | 7.9% | 4.3% |
| Worst Decline | (25%) | (13%) | (14%) |
| 2000-March 2009 | Alt Equity | Alt Bond | Stand-Alone |
| Annualized Return | 4.9% | 12.0% | 7.5% |
| Worst Decline | (25%) | (10%) | (10%) |
| March 2009-Present | Alt Equity | Alt Bond | Stand-Alone |
| Annualized Return | 11.0% | 4.4% | 1.6% |
| Worst Decline | (15%) | (13%) | (14%) |
Source: Bloomberg
Both the alternative bond and alternative equity investments handily beat the stand-alone managed futures from 2000 until now by nearly 4% annually. The alternative bond delivered higher annual return from 2000-2009 versus the stand-alone managed futures and the alternative equity alike. Since 2009 – along with the surge in equity returns – the alternative equity investment has clearly outperformed both the stand-alone managed future and the alternative bond.
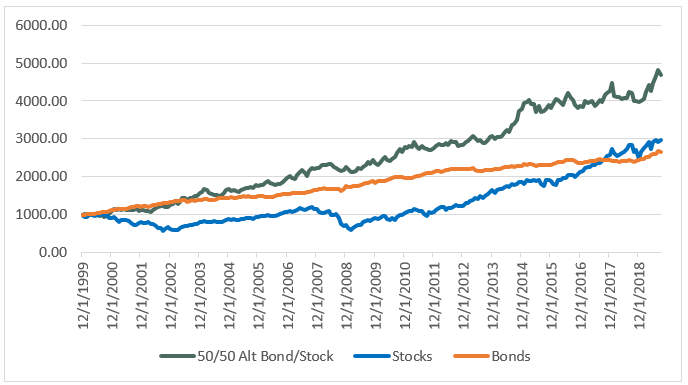
Each investment has its own merits and there are reasons to incorporate both strategies. The last chart shows a 50/50 blend of these two different investments.
Alternative Equity/Bond Blend vs Stocks and Bonds

Source: Bloomberg
As seen above, an investment blending both the alternative bond and the alternative equity beats traditional stocks and bonds over the entire time horizon. As we look toward the future with even lower projected returns for traditional assets, these types of investments may become even more important for delivering greater returns for investor portfolios.
Disclaimer
The performance data displayed herein is compiled from various sources, primarily Bloomberg. Portfolios are comprised solely of benchmark indices and are rebalanced monthly except where noted otherwise. Benchmark index performance shown is primarily from Bloomberg Barclays indices. Exceptions are S&P 500 for U.S. equities and Societe General CTA Index for managed futures. These indices are for the constituents of that index only, and do not represent the entire universe of possible investments within that asset class. And further, that there can be limitations and biases to indices such as survivorship, self-reporting, and instant history. Past performance is not indicative of future results.

