I don’t know about you but I’m getting tired of seeing nothing but doom and gloom in print, on social media, and on the news. Yes, the global economy is slowing. Yes, most stock markets have largely gone nowhere for 19 months while experiencing wicked short-term bouts of volatility. Yes, the U.S. has just come off 9 consecutive quarters of 20%+ sales and earnings growth and should be expected to slow from a historic ramp in growth. Yes, we are in a global manufacturing slowdown or recession, depending on the country. Yes, the world’s governments and corporations lathered up with debt because central banks suppressed interest rates and attempted to push us all out the risk-taking spectrum in an attempt to stimulate growth and ward off deflation. Yes, investors are running for the equity-exit-doors and stampeding into cash, short-term bonds, “low-vol” equities called bond proxies, and long duration treasuries as a safe haven. Yes, our President is pushing a trade war with the world’s second largest economy, China and pushing in a way that will likely NOT get him the desired result he seeks. Yes, this is causing major ripples across global supply chains. Yes, roughly 50% of all government bonds around the world yield less than zero which is driving a massive wall of capital to any geography offering a positive yield to compensate for negative local yields. And finally, Yes, this is causing the masses to assume that our inverted yield curve is a harbinger for an imminent recession. These are all “known-knowns.”
That said, this begs the question: When everyone is universally bullish, is it generally the best time to buy an asset? The answer to that question, is no because you don’t usually get the best pricing.
Currently, we find ourselves in the opposite situation. Yes, there’s lots to worry about. Show me a time when there’s nothing to worry about and I’ll show you a time to be very worried (think 2000, 2007). My issue with all this doom and gloom isn’t the narrative, it’s how crowded the trade is and how confident people are in the imminent demise of risk assets all over the world. Right or wrong, I’m programmed to fade a crowded trade, particularly when it feels extreme. At the current time, the doom and gloom feel’s quite extreme, particularly as I watch the same news stories running each and every day.
Is this a Bull Market?
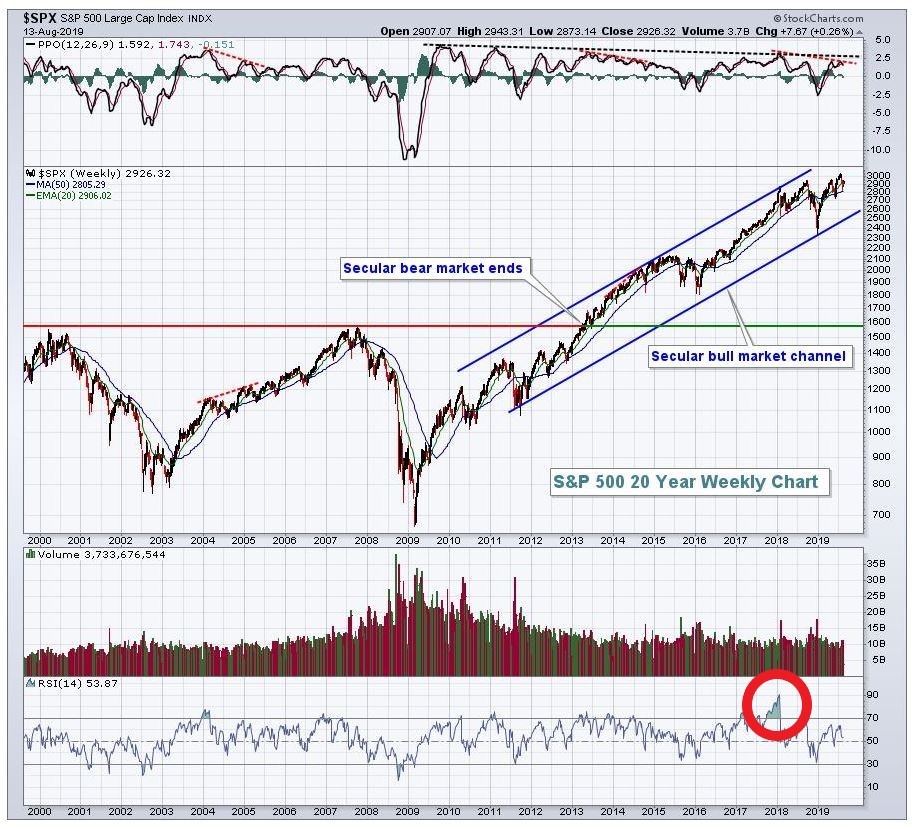
As a portfolio manager, I pay attention to the short-term trends as well as the dominant trends. Sometimes they are in sync, sometimes they are at odds with each other. Today, they are at odds with each other. The dominant trend is what drives more of my thinking. Why? Because if you get the direction of the dominant trend correct, you tend to win more often than you lose, and you don’t get whip-sawed and miss massive secular moves in great stocks. Currently, the dominant trend remains up and we are in the middle of the up channel. That means we can rally or fall on any given day, week or month and it’s just noise. Corrections happen, volatility spikes on occasion. Yes, as a Portfolio Manager my team and I will often make moves in a portfolio but largely, so long as the dominant trend is up, we are excited to buy and hold the stocks of high-quality companies serving global consumers. Right now, many of those great brands are on sale.
Here’s a visual of what I’m talking about. Important: Notice the red circle at the bottom right at the beginning of 2018. The market was historically overbought and sentiment towards equities was about as extreme and positive as it ever gets. In my opinion, we are still working off those extreme optimism readings and to accomplish this, the readings often have to go to extreme pessimism. That’s the process we are working on right now.
Fear Inhibits Risk Taking
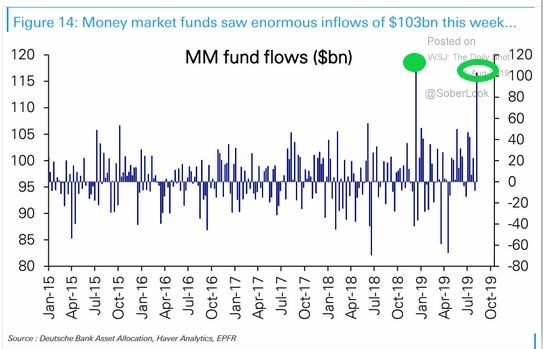
In the investment business, extreme fear causes extreme shifts in one’s portfolio from “risk taking” to “risk avoidance”. The image below highlights how much fear there is today as assets in money markets continue to swell. In fact, the recent move into money markets has not been this extreme since November 2009. Remember 2009? I certainly do, it generally wasn’t a time to hide under the table, it was a time to be opportunistic and buy high quality businesses when no one wanted them.
Here’s the current money market situation, similar to Christmas Eve last year.
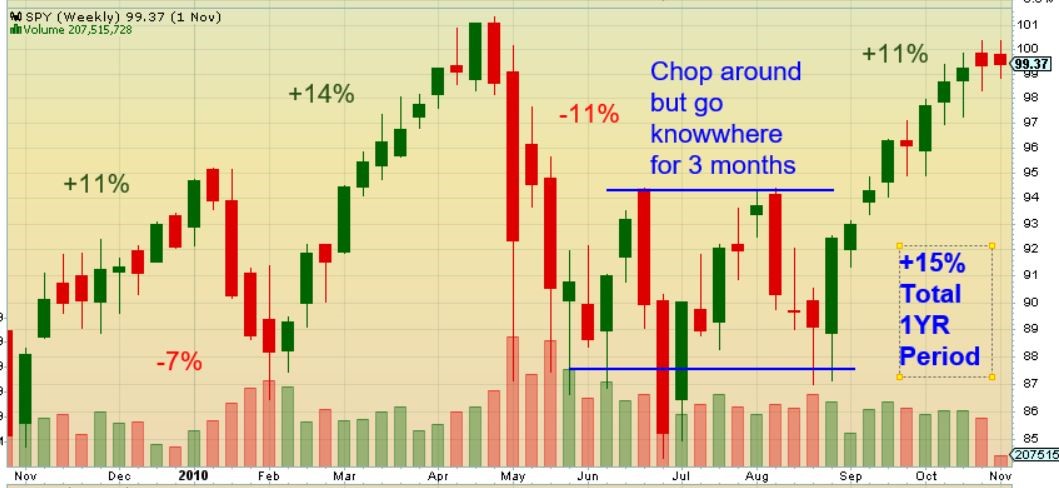
Here’s the S&P 500 1-year chart from November 1, 2009 to November 1, 2010. When people reference periods of history for affect, I always like to look at what happened next with the understanding that the future does not always look like the past. Result: lots of volatility but if you were able to block-out the noise, not a bad one-year experience. I suspect we have a similar experience so bring your Dramamine tablets for the roller coaster ride.
INTEREST RATES:
Interest rates around the world are falling driving a massive amount of money to seek better opportunities. That’s not new, that’s just how markets work. Because of this phenomenon, distortions are happening. At the current time, money is chasing very expensive fixed income and certain equity assets because they are perceived as “safe.” But we all know the more expensive an asset gets and the more illogical the stampede; the riskier it generally becomes. The classic definition of a bubble is having the masses believe there’s no risk of loss while they get leveraged and deeply invested in the asset. This situation can last for longer than people expect, but in the end, logic and reason win, a catalyst for change occurs and the stampede turns tail and runs through a narrow door leaving skid-marks. One day, this safety money will do the same and this money will seek new opportunities and turn back to the equity markets. Given the massive amounts of money sitting in “safety assets” and money markets, what a robust equity rally it will be. In the words of a great investor, Ray Dalio of Bridgewater, “It’s better to be early than late to a great party.”
Chart 1 highlights the current dividend yield for the S&P 500 at 0.38% above the 10-year yield. Here are the times when it was above 0.35%. Again, not a bad time to be fading the doom and gloom even if markets continue to exhibit bouts of volatility.
Chart 1:
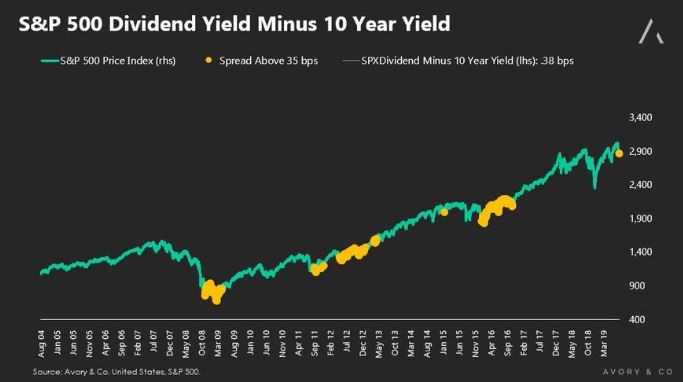
Source: Avory & Company.
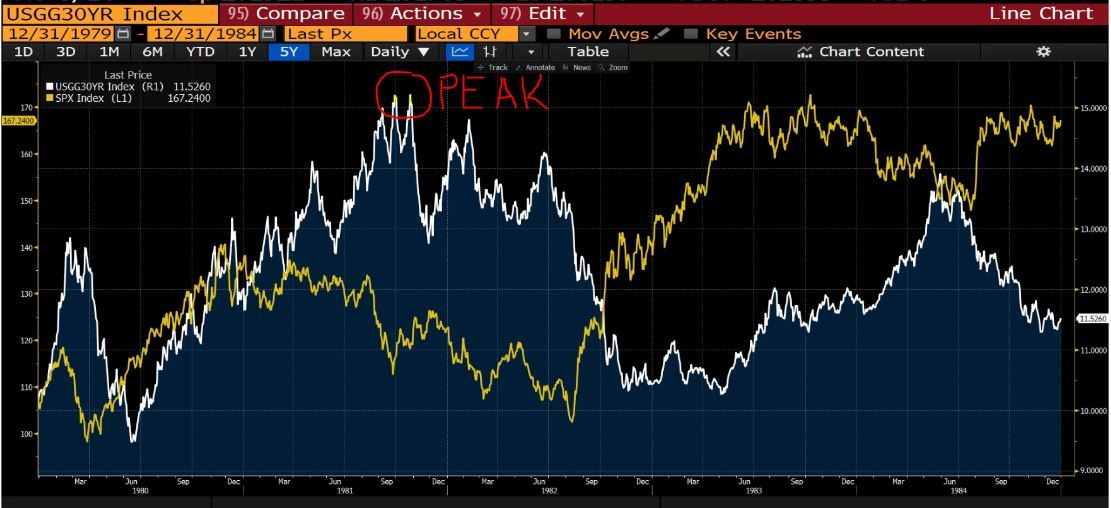
Chart 2 highlights the beginning of the current 38-year bond bull market in 1981. Interest rates (30 year Treasury depicted in the chart) went vertical to 15% having a full upside capitulation, moving +50% in 14 months before beginning the long slide to where we are today at 2%. This is how capitulation works, in my humble opinion, we are all watching the downside capitulation in global interest rates that everyone has been talking about since 2013. Beware of “safety assets” for they may not be as safe as they appear soon enough. The main point here is: BUY FEAR, SELL EUPHORIA, particularly when it feels very ackward.
DISCLOSURE:
This information was produced by and the opinions expressed are those of the author as of the date of writing and are subject to change. Any research is based on the author’s proprietary research and analysis of global markets and investing. The information and/or analysis presented have been compiled or arrived at from sources believed to be reliable, however the author does not make any representation as their accuracy or completeness and does not accept liability for any loss arising from the use hereof. Some internally generated information may be considered theoretical in nature and is subject to inherent limitations associated therein. There are no material changes to the conditions, objectives or investment strategies of the model portfolios for the period portrayed. Any sectors or allocations referenced may or may not be represented in portfolios managed by the author, and do not represent all of the securities purchased, sold or recommended for client accounts.


