

Key Summary:
- Investors have much more tech exposure than they realize.
- Adding exposure to strategies that look very different than the indexes adds value.
- When sentiment is dreadful, and the earnings data is stable, opportunities exist.
Very Important thesis: If equities generate roughly 8-10% a year over time, leading brands serving the dominant driver of the economy, in theory, should compound at 10-15%+ over time. We have significant proof on this topic. In a world where rates and inflation are higher than we might like, business models with pricing power, exposure to quality factors, and that generate strong profits and free cash are set up to win versus the typical peer. Brands Matter.
Adding dedicated consumer exposure has never been more compelling in our view.
Allocators add new exposures for a variety of reasons; diversification, returns, risk mitigation, etc. Understanding this, what is the most over-owned and expensive sector today? Technology, by a country mile. Generally, exposures here have been a net positive for total returns which means most have become a bit complacent about exposure levels. As the market often does, it drives themes and narratives to extremes. It’s at the extremes when much more volatile outcomes can happen. That’s where I think we are in technology broadly today. As I’ve stated before, the largest allocation in most investor portfolios are stocks that generally fall into the large blend and large growth style boxes. Understanding how these two indices are allocated is vital to the risk management of client portfolios given the size of the allocation for the average investor. The S&P 500 is the benchmark for the S&P 500 and the Russell 1000 Growth for the large growth style box.
Here’s how passive and most active funds are positioned given their benchmarks: Currently, 49% of the large growth benchmark is technology. But it doesn’t stop there, another 12% is allocated to Communications Services, which is another proxy for technology companies. So, the R1G is 61% “tech”, plus a few tech-focused Consumer Discretionary stocks at a roughly 8.5% weighting, bringing the real total of tech to about 70%. Turning our attention to the S&P 500 Index, the tech weighting here is 31.5% plus another 8.8% in Communication Services, plus another roughly 5% in Consumer Discretionary, tech-related companies. This brings the total to about 45% in tech exposure. That’s a lot of tech and a lot of double exposure to the same stocks in the largest part of most portfolios. The good news: many of the mega cap tech brands are high quality and have extraordinary moats around their businesses. Unfortunately, most are outright expensive at this point. BTW, this exposure data doesn’t include the heavy weights to tech at the mid-cap, small-cap and international growth and blend levels. The average investor now has massive tech exposure. Just something to ponder as an allocator and Fiduciary.
Perhaps adding exposure to strategies that look very different to these heavy tech exposures is warranted with tech valuations near all-time highs? Perhaps there are other thematics and exposures that warrant attention? Maybe something that’s logical, defendable, radically under-owned, out of favor, and historically has performed well over time? The average consumer stock certainly fits this description.
The Case for Adding Dedication to the Consumer.
It’s always been our view that the most defendable core equity allocation should be directly tied to the core driver of the economy in which we invest. In the U.S. and around the world, household spending drives everything. Globally, the theme is a $50 trillion annual opportunity for investors. The major disconnect: very few investors have any dedication or meaningful exposure to the largest phenomenon on the planet. That’s why we created the Brands strategy in 2016.
Consumer stocks are incredibly under-owned today. Here’s some proof: Simply adding up all the assets in ETF’s with over $100M in AUM shows the total assets in Tech ETF’s alone at $255.1 billion. Contrast that to the Consumer Discretionary sector at $28.8B and Consumer Staples also at $28.2B. Plus, another $10B in consumer-related mutual fund assets. The data is very clear, EVERYONE is under-weight the consumer. So collectively, there’s 10x more assets in Tech ETF’s & funds versus Consumer-dedicated investment products even though the total value of the discretionary and staples stocks is well over $17.7 trillion. I assure you if we ever had another 2000-2003 tech wreck or a style shift away from tech, the attorneys would be asking allocators if they knew how much exposure they had to tech and tech related stocks. The answer generally would be, “I had no idea.”
Consumer Stocks: A Recent Earnings Season Summary
The narrative in the media is, “the consumer is tapped out.” As someone who spends 100% of his time analyzing consumer habits, spending trends, and consumer balance sheets, I can say the truth is much more nuanced than this catchy headline. A few weeks ago, I wrote a note asking if the consumer was tapped out or just “opting out” of broad purchases. There’s a big difference here. Consumers are voting with their wallets and telling brands across all categories, “get your prices back in-line or we will defer our spending.” I’m hearing the responses from brands in this earnings season. They have gotten the message, are working on bringing down prices, and heavily focused on bringing internal costs down to combat the mean reversion in margins. Some brands have the luxury and ability to beat EPS even when they are lowering prices, others do not. That’s where stock selection comes in. Additionally, we are still seeing a consolidation of shopping visits that began in the pandemic. There are clear winners and losers today as consumers continue the habits, they formed in 2020-2021. I have not seen this bifurcated a consumer spending market in my 30 years analyzing the industry.
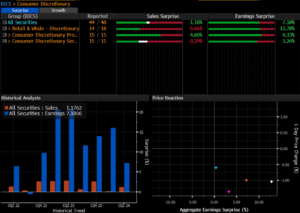
This earnings season highlights how stable the consumer sector is, even if the stocks can be volatile on occasion. In the graph below, I show the summary of the Consumer Discretionary sector across industries via the avg sales and EPS results versus expectations.
Like many other sectors, the sales line was generally in-line without a ton of growth, but the EPS surprises are where the opportunities are showing up. Interestingly, the service names are finally seeing slower trends after 2 years of above average growth while the goods sector begins to normalize higher. Remember, most earnings revisions down were from the goods sector and this quarter hints we have likely seen a trough in downside revisions.
Consumer Discretionary
E-Commerce Within Consumer Discretionary – It’s an Amazon world.
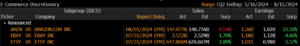
Amazon is the 800lb gorilla in the fastest growing portion of retail, e-commerce. Amazon is one of the most recognized and relevant brands in the world and it’s by far, the cheapest of the Mag7 stocks. With a slow and steady growth profile for the core retail business and more margin expansion on the horizon, plus the faster growth businesses of advertising, subscriptions, and AWS Cloud and AI, the sum of the parts valuation today shows Amazon to be about 35%+ undervalued. Below is a Bloomberg snapshot of the recent earnings results for AMZN. When you get strong EPS (+23% surprise vs street estimates), which includes superior “cost to serve” datapoints, over time you generate significant free cash flow with the opportunity to reinvest this cash for high rates of return. That’s why they call these stocks “compounders.”
Consumer Staples
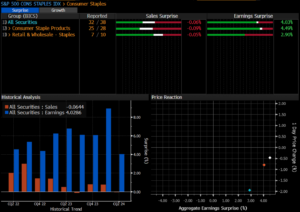
Consumer Staples tend to lag in up markets and play catch-up in tougher environments. With growth downshifting, I’m not surprised to see money flow towards more defensive sectors like Staples. Generally, most of these great brands have little to no sales growth and high valuations. In short periods of time, market participants don’t care, they just focus on the defensive qualities of the stocks. A look below at the sales and EPS results highlights very little growth but decent beats on the EPS line again. You see the trend here? Companies across most sectors are focusing on being operationally fit and driving cost efficiencies that create EPS beats. Implementing AI initiatives will further drive these EPS beats, but it will take time.
Important Disclosure: The above data is for illustrative purposes only. This information was produced by Accuvest and the opinions expressed are those of the author as of the date of writing and are subject to change. Any research is based on the author’s proprietary research and analysis of global markets and investing. The information and/or analysis presented have been compiled or arrived at from sources believed to be reliable, however the author does not make any representation as their accuracy or completeness and does not accept liability for any loss arising from the use hereof. Some internally generated information may be considered theoretical in nature and is subject to inherent limitations associated therein. There are no material changes to the conditions, objectives or investment strategies of the model portfolios for the period portrayed. Any sectors or allocations referenced may or may not be represented in portfolios managed by the author, and do not represent all of the securities purchased, sold or recommended for client accounts. The reader should not assume that any investments in sectors and markets identified or described were or will be profitable. Investing entails risks, including possible loss of principal. The use of tools cannot guarantee performance. The charts depicted within this presentation are for illustrative purposes only and are not indicative of future performance. Past performance is no guarantee of future results.