

Key Points
- The Bernanke-Yellen-Powell period is abnormal regarding Fed Funds & CPI.
- The economy and stocks have performed well in more normal & higher periods.
- The road to “normal” has been rocky but normal is a much healthier destination.
Zero Interest Rates and a Low Cost of Capital is Neither Normal nor Healthy.
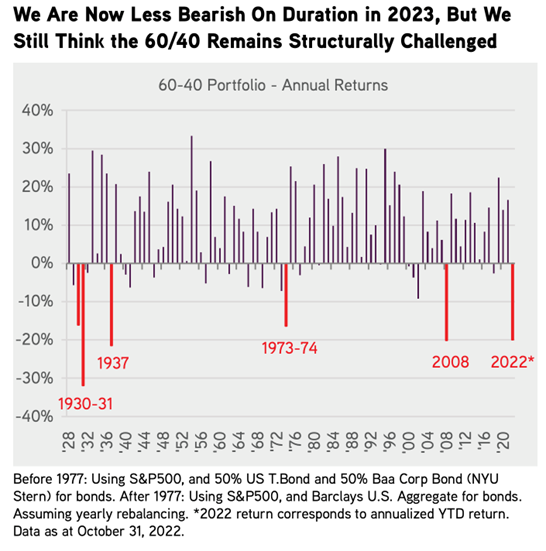
2022 has been one of the most difficult environments for investors of almost every asset class. If you need proof, here’s the updated 60/40 portfolio yearly scorecard going back in time via a recent report from Private Equity leader, KKR:
As you know, interest rates and inflation have been on the rise and the trajectory has been severe. It’s important to remember that the inflation we have today is largely man made and the trajectory of rates and inflation is the “accident” that caused all the chain reactions in asset prices. We can thank our politicians and the Federal Reserve for higher prices and the carnage in our investment portfolios. It didn’t have to happen this way. I could write a separate blog on the arrogance and ineffectiveness of the Fed as an organization but suffice to say, the real problems likely began when Ben Bernanke arrived at the Fed in 2006. The trio of Bernanke, Yellen, and Powell has consistently gotten important decisions wrong, failed to see trouble when it was obvious to others, acted too late, and stayed easy far too long. It seems absurd that any central banker could be successful at smoothing the business cycle, let alone for Powell and Co. to accomplish this for a $21 trillion economy.
Regardless, we all must decide how to allocate for the next one, three, and five years with a new normal in mind. We know with certainty that the Fed wants to normalize rates after holding them artificially low for over a decade. Man-made inflation gives them air-cover to do so. Every consumer and every investor needs to have a grasp of history during higher rates and higher inflationary periods. With that in mind, I wanted to offer some perspectives and only the facts. The last 16 years with zero rates and abundant access to capital at almost zero cost are gone. This was an abnormal time, and our muscle memory needs to be re-set. Currently, the bears will say this reality makes it difficult for asset price appreciation. So, rather than state my opinion, I wanted to look back in time to see what happened in other periods when rates and inflation were higher. The data source for Fed Funds & CPI data come from the St. Louis Fed website and the S&P 500 data is from Bloomberg:
Normal:
From 1/1/1955 to Ben Bernanke’s arrival at the Fed 2/2006, Fed Funds averaged 5.63%.
Over this same period, the average CPI (inflation gauge) was 4.0%.
During this 50+ period, U.S. GDP averaged 3.24%.
The S&P 500 annualized at 10.85% and its cumulative return was 19,244%.
Abnormal:
The Bernanke, Yellen, Powell era.
From 2/1/2006 to the pivot point in rates on 3/2022, Fed Funds averaged 1.13%.
Over this same period, the average CPI (inflation gauge) was 2.2%.
During this 16-year period, U.S. GDP averaged 1.73%.
The S&P 500 annualized at 14.7% and its cumulative return was 392%.
Perspective: Alan Greenspan was the Fed Chairman from 1987 to 2006 when he handed the reigns to Ben Bernanke. Here’s what a more normal period looked like under Greenspan:
Fed Funds averaged 6.73%.
Average CPI (inflation gauge) was 4.3%.
U.S. GDP averaged 3%.
The S&P 500 annualized at 10.63% and its cumulative return was 424%.
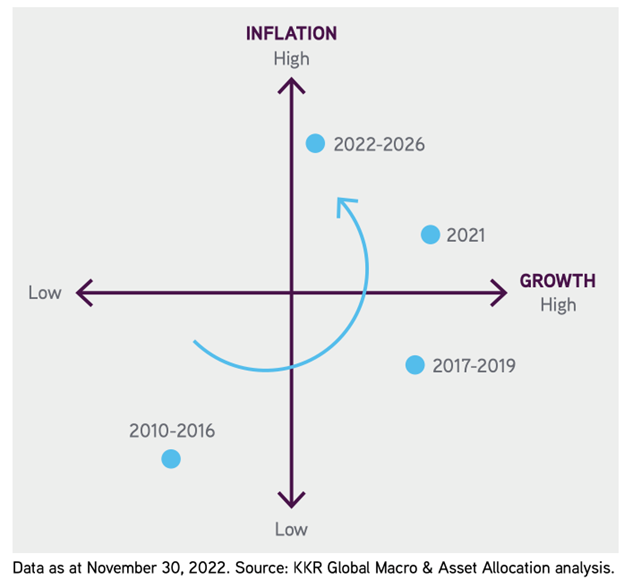
If I were a betting man, I would guess the next five years looks like a Fed Funds average rate of between 4-5% and a CPI that averages 4%. This just happens to be in-line with the long-term ranges. Here’s a graph showing how the smart professionals at KKR see the next few years. In short, growth is generally fine and inflation metrics mean revert towards long-term norms.
Conventional Wisdom: “Stocks Cannot Generate Attractive Returns with Higher Rates And CPI”
Here’s where the research project gets fun and interesting. Remember, from an interest rate and CPI perspective, it’s the speed of the move that matters much more than the direction. The Fed’s new “projected” target rate is somewhere between 4.75% and 5.75%, a wide delta one could drive a truck through.
The uncertainty should continue for a little while longer. But the good news for investors with more than a five-day time horizon is that they’re getting some very attractive buying opportunities between now and when the Fed ultimately decides to slow the pace of tightening as we get back to normal rates. I suggest you buy in tranches because catching the bottom is always very difficult. I have already shown you the value of using a cost averaging strategy in former posts.
At 4.25%-4.5% today, the bulk of the rate increases have largely been accomplished and the market is now adjusting for this updated range from the Fed. As the economic data and the economy get weaker, inflation should continue to trend lower, long-term rates should also trend lower and the Fed can then begin to ease up on the aggressiveness (trajectory) of the hikes. That should be greeted positively by markets, particularly given how currently bearish positioning and sentiment are.
Below, I have listed extended periods where the Fed Funds rate ranged between 3% and 5.5% with a more normal CPI versus the most recent abnormal period. This range in these metrics is likely what we will experience over the next five years
From 7/1/1963 to 11/1/1968, Fed Funds rate averaged 4.39% with CPI averaging 2.4%.
The S&P 500 Index delivered a total return of 11.2% annualized and 77% cumulative.
From 8/1/1970 to 1/1/1973, Fed Funds rate averaged 4.82% with CPI averaging 4.66%.
The S&P 500 Index delivered a total return of 22.3% annualized and 63% cumulative.
From 3/1/1975 to 8/1/1977, Fed Funds rate averaged 5.26% with CPI averaging 6.9%.
The S&P 500 Index delivered a total return of 12.8% annualized and 34% cumulative.
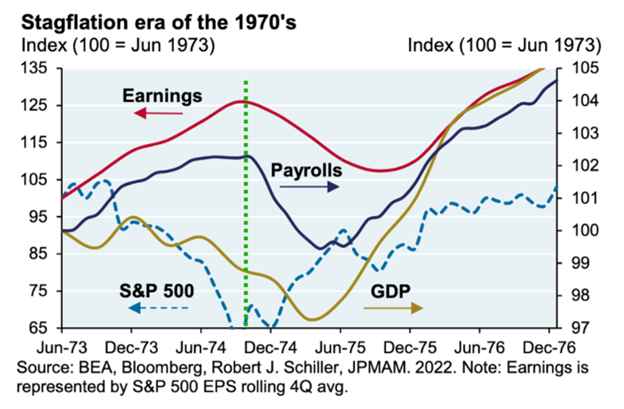
This is very interesting. Here’s a chart from Michael Cembalest of J.P. Morgan showing the 1973-1977 bear market along with the trajectory of earnings, payrolls, and GDP. People constantly cite the 1970’s and 1980’s as the most similar time periods to our current experience. Earnings and payrolls peaked about the same time as stocks bottomed out after a big drawdown. We will have to wait and see if a similar experience occurs in 2023. Nobody expects it, that is for sure. In the 1980’s double dip recession, earnings again held up as the market fell precipitously. The market fell about 10% more from the peak of earnings to the trough in markets. Again, we will have to wait and see how 2023 turns out.
Here’s the other periods that looked similar to what we expect going forward. Again, much better than the current bearish expectations.
From 5/1/1991 to 5/1/2001, Fed Funds rate averaged 4.92% with CPI averaging 2.7%.
The S&P 500 Index delivered a total return of 15.25% annualized and 313.7% cumulative.
From 8/1/2005 to 1/1/2008, Fed Funds rate averaged 4.76% with CPI averaging 3.2%.
The S&P 500 Index delivered a total return of 9.4% annualized and 24.5% cumulative.
Just for fun, I looked at the data series for periods when Fed Funds & CPI were mostly well above average just to see what stocks did during these periods. The most prevalent period from 1955 to today is highlighted below. Honestly, I would not have expected the outcome below, but it’s a pleasant surprise.
From 9/1/1977 to 4/1/1991, Fed Funds rate averaged 9.5% with CPI averaging 6.1%.
U.S. GDP averaged 3.1% annually over this roughly 14-year period.
The S&P 500 Index delivered a total return of 15.4% annualized and 635% cumulative.
You can be sure the earnings and margins of companies were impacted by high rates and inflation just as people expect for 2023. Yet somehow the market managed to deliver attractive returns to patient investors. Perhaps history will rhyme going forward.
Importantly, markets were volatile given the uncertainty. During this period there were two 15% drawdowns during 1982 and 1990. There was also a major drawdown in 1987, which was created by the long-term capital portfolio insurance debacle. Yet despite this, stocks performed above long-term averages even when considering corrections and a full market crash. Don’t lose sight of the big picture.
The Good News: The Destination of Normal is a Much Healthier Place Long-Term.
Getting back to normal and staying there for as long as possible is a very positive development. Please make sure you own high quality assets with strong balance sheets and leadership positions in key industries. Sanity is coming to a theatre near you. The journey has been rocky, but the destination looks more like goldilocks.
Disclosure:
This information was produced by Accuvest and the opinions expressed are those of the author as of the date of writing and are subject to change. Any research is based on the author’s proprietary research and analysis of global markets and investing. The information and/or analysis presented have been compiled or arrived at from sources believed to be reliable, however the author does not make any representation as their accuracy or completeness and does not accept liability for any loss arising from the use hereof. Some internally generated information may be considered theoretical in nature and is subject to inherent limitations associated therein. There are no material changes to the conditions, objectives or investment strategies of the model portfolios for the period portrayed. Any sectors or allocations referenced may or may not be represented in portfolios managed by the author, and do not represent all of the securities purchased, sold or recommended for client accounts. The reader should not assume that any investments in sectors and markets identified or described were or will be profitable. Investing entails risks, including possible loss of principal. The use of tools cannot guarantee performance. The charts depicted within this presentation are for illustrative purposes only and are not indicative of future performance. Past performance is no guarantee of future results.