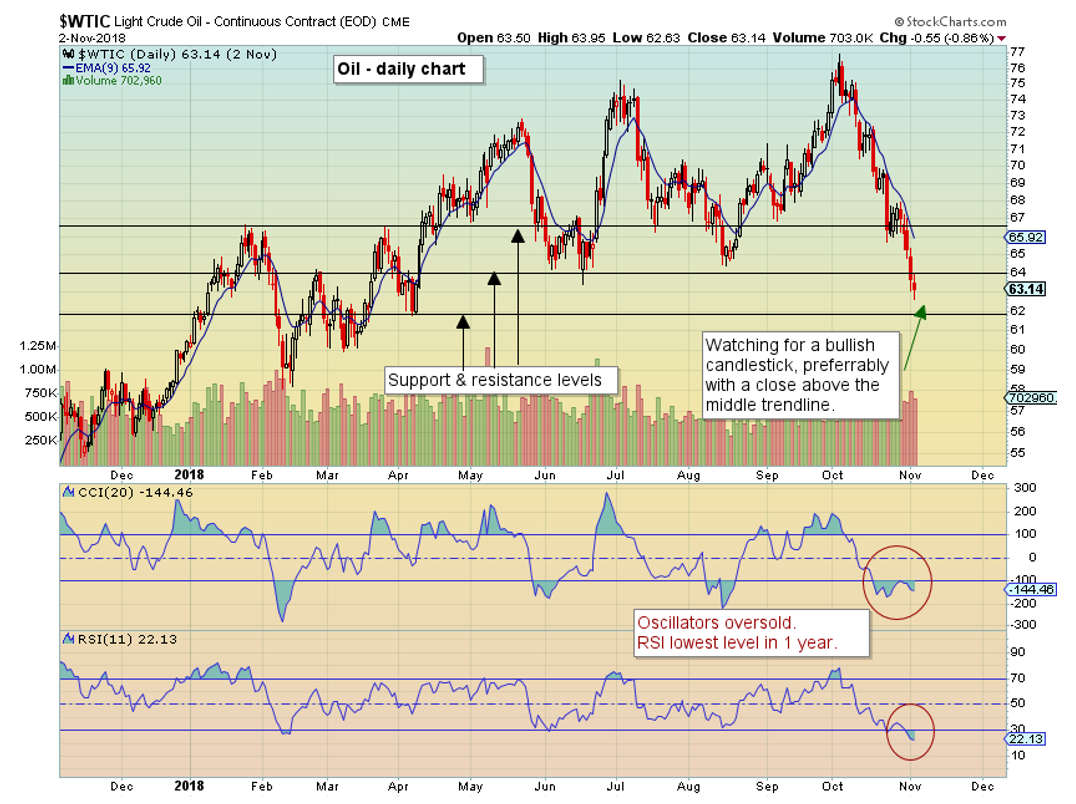
October was a brutal month for oil. Crude dropped by nearly 20% in October and the decline continued into November. The technical indicators on the daily chart are in oversold territory and the RSI (relative strength Index, 11 period) is the lowest we’ve seen all year. The oscillators are indicating the move may become exhausted at these levels, however price has not confirmed.
The candlestick from the close of last week did not touch the lower support line, the day closed lower than where it opened, and volume was quiet heavy yet. Watching the chart for a break below the next lower support level, or waiting for a bullish candlestick with a close above the middle trend-line near 64 could be wise.
Trading in-between support and resistance levels without a clearer direction in the charts can lead to great frustration. Using the lower level as a support with a stop below it could be a strategy if not wanting to wait. But remember…nothing is wrong with waiting. We believe that there is always another trade and cash is a position too.

This is for educational purposes only and should not be considered investment advice.
The post Oil’s Chart After the 20% Selloff appeared first on Catalyst Hedged Commodity Strategy Fund Blog.

