On Tuesday, oil sank over 3%, marking a clear breakdown from the recent high near $61. Prices have had a wide range so far this year. Looking at charts for possible signs of price exhaustion or biases for any indication on movements can be helpful. Currently, multiple factors have aligned to support a negative lean for oil prices.
Three Oil Charts
1st Chart:
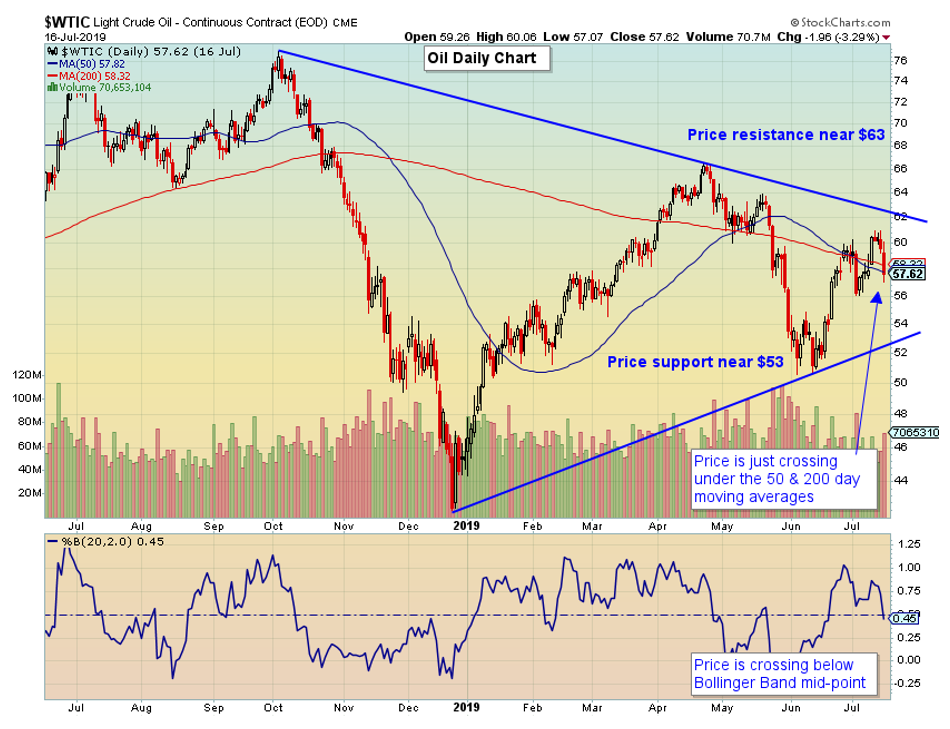
- Price closed near the 50 & 200-day moving averages, and at the mid-point of the Bollinger Bands (%BB, lower part of chart).
- Wednesday’s price action followed through, breaking below the moving averages.
- A price range triangle shows resistance near $63 and support near $53.

2nd Chart:
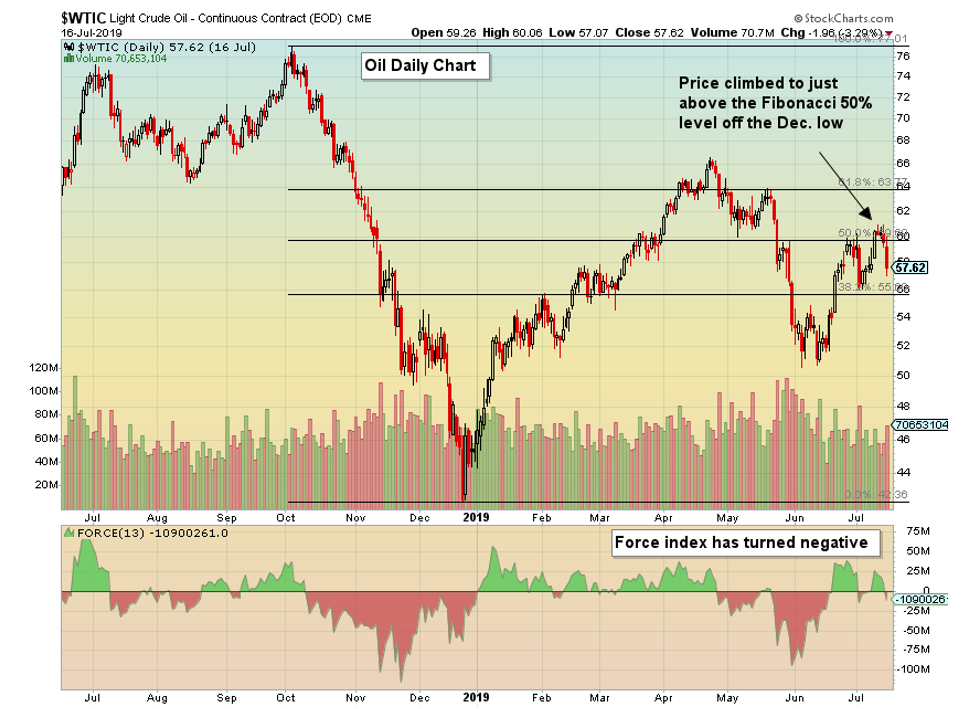
Two items of interest here. First is the Fibonacci Retracement Level which price slightly exceeded on its last advance. What I found interesting with this indicator is that when removing the price spike down in Dec., and using $44 as the low, then the 50% retracement comes right to where price stopped near the $61 level.
Underneath prices shows the Force Index, created by one of my favorite technical analysis authors, Dr. Alexander Elder. Stockcharts.com defines the Force Index as:
The Force Index is an indicator that uses price and volume to assess the power behind a move or identify possible turning points. According to Elder, there are three essential elements to a stock’s price movement: direction, extent and volume. The Force Index combines all three as an oscillator that fluctuates in positive and negative territory as the balance of power shifts. The Force Index can be used to reinforce the overall trend, identify playable corrections or foreshadow reversals with divergences.
The Force Index just turned negative.

3rd Chart:
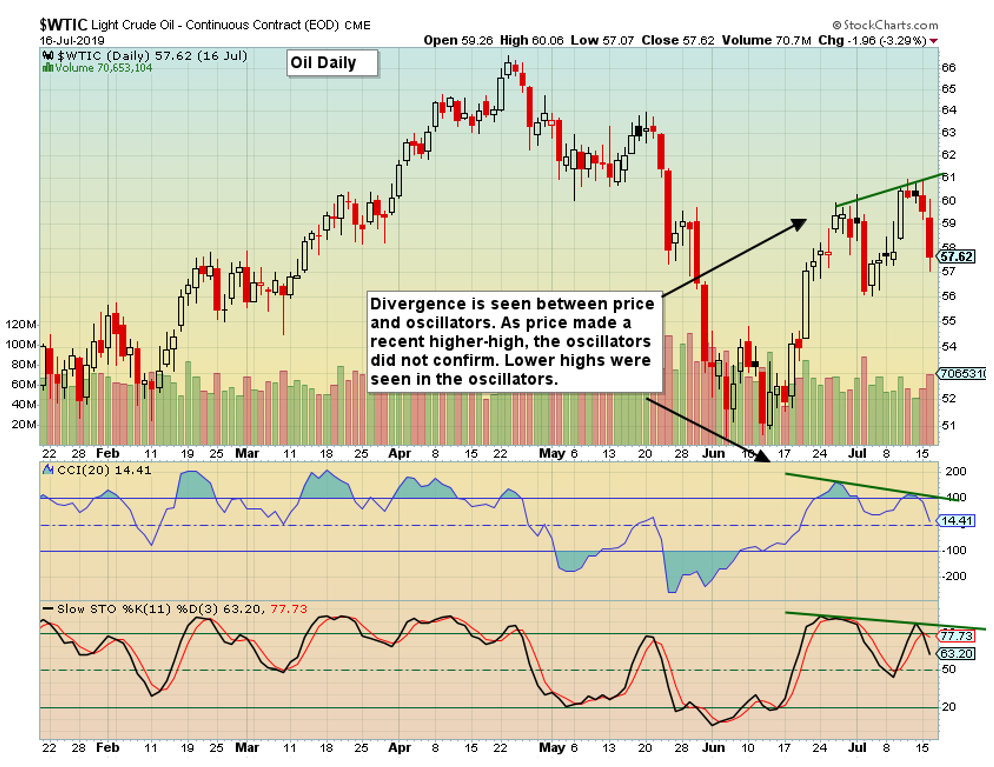
Last, we see divergence between price and the CCI & Slow Stochastic oscillators. Divergence occurs when price rises to higher highs, but the oscillators have lower highs. This “divergence” is a non-confirmation of the bullish price move and can indicate a change in direction.

In summary, bearishness is visible in the charts:
- Price is trading below moving averages and Bollinger Band mid-point
- Price turned down after reaching the 50% Fibonacci level
- The Force Index has turned negative
- Divergence between price and oscillators
Looking for a closer support for prices would indicate the $56 area where price bounced from in early July.
Disclaimer: Author holds and trades both long and short positions in oil.

