

Today I want to start off with some great news. Why? Because there doesn’t seem to be very much of it being reported these days.
Nike is a growth company, period! Nike recently reported their earnings and the company’s latest financial report highlighted the fact that the most relevant, most powerful brands serving key consumption categories seem to be weathering “storms” better than most other sectors of the economy.
Why is this the case? Because they resonate with millions of consumers, they empower them, they motivate them and they provide the products and services they want, while delivering those in the forms they require. When a brand really resonates with a consumer, they stay loyal. The result is stronger sales and stronger pricing power. Having those key attributes helps a brand withstand things like trade wars, currency headwinds and slowing economic data.
For a full write-up of Nike, visit the global brands website https://www.globalbrandsmatter.com/nike-nke
Ok, now I’ll address the gloom and doom that seems to be growing these days.
Yet again all I see, read, and hear is gloom and doom. I see the same information that everyone sees: inversion of the yield curve, $17 trillion in negatively yielding bonds, slowing economic data here and abroad, trade war with China, uncertainty around policies from the White House, impeachment proceedings, shortage of U.S. dollars in the system creating a potential liquidity problem at some point, defensive equities performing well while growth equities getting sold, valuations are high (not real specific), earnings growth is negative, the Federal Reserve (Fed) raised rates too fast and is now behind the curve as the economy slows off nine consecutive quarters of 20%+ sales and earnings growth, the Saudi’s are fighting with Iran over oil and the Saudi Aramco ipo hangs in the balance, commoditity prices are falling, there’s a manufacturing recession in many countries like Germany, China’s economy is crashing and the U.S. is forcing manufacturers to leave China, which hopefully puts pressure on them to deal with the U.S. in a better way.
Question: If you were dropped from Mars today and read all those headlines would you expect the S&P 500 to be within 3% of its all-time highs or would you expect to see the market down 50% from the highs? FYI, we are less than 3% from all-time highs.
Question:
Is it possible that all this terrible stuff is already priced into markets because it is already a consensus “known”?
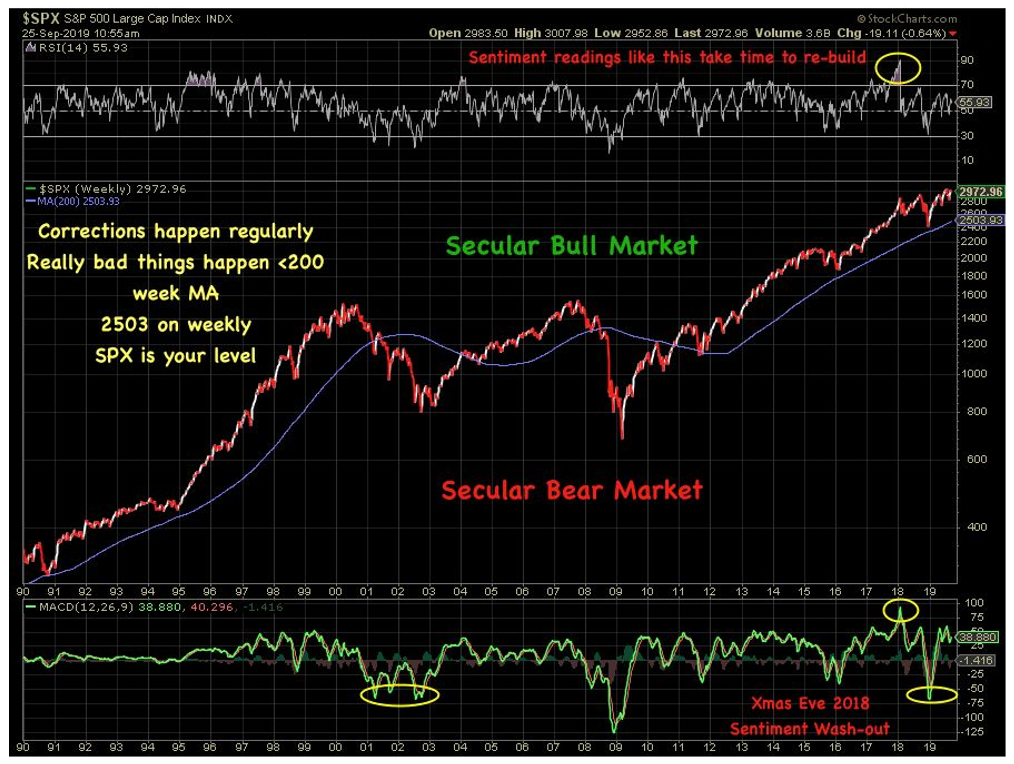
Is it possible that the news is so bad, it’s likely to get marginally better over the next 12 months? Look at the last chart in this blog post, is today’s poor equity sentiment the exact opposite of what we saw at the top in January 2018? It certainly feels that way to me.
My job is to manage portfolio risk and generate attractive returns for investors. Sometimes that’s easy and sometimes that’s more difficult. Today we are in the “more difficult” phase of making money. I think it’s important though to remember that the biggest draw-downs for equities tend to happen when the economy slows and a recession begins. How do we assess whether a recession is likely? We look at the components of GDP and watch the data’s rate of change.
Reminder: 72% of U.S. GDP is the consumer and spending. Let’s look at some charts that speak to the health of the consumer and her the potential consumption capacity. These are not opinions, these are data-points.
Chart #1: Household net worth via housing equity – Strong-no tapping of equity present like ‘07
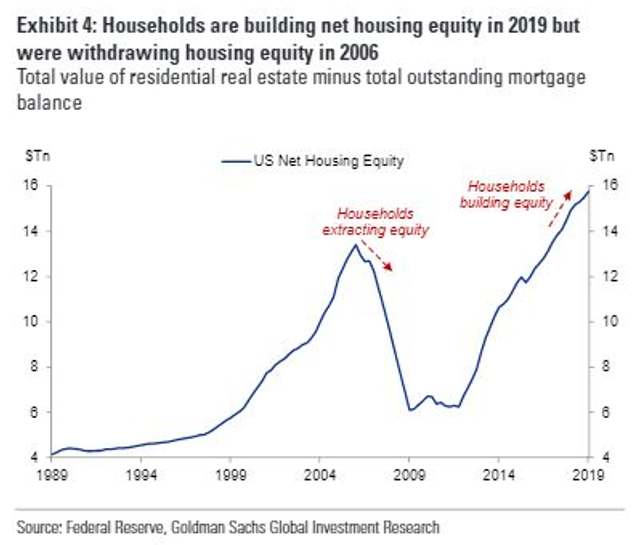
Chart #2: Wages – Increasing across all income levels is bullish for spending
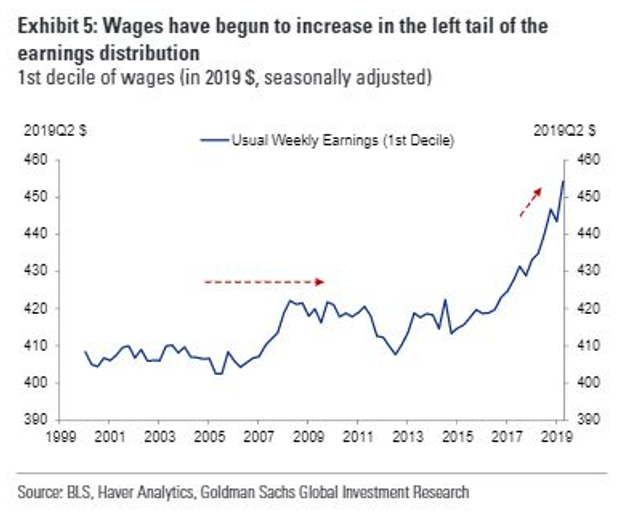
Chart #3: Household debt – low and steady so no imminent stress on the consumer is present
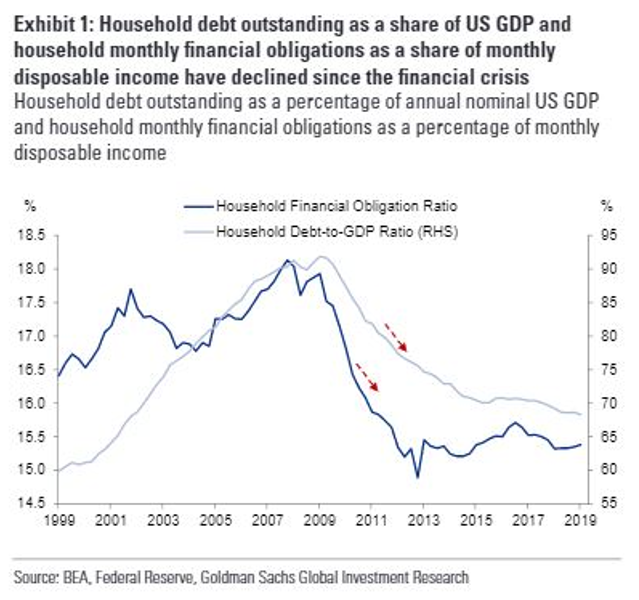
Chart #4: Unemployment low – particularly for lowest education. Yes, it’s a lagging indicator but let’s see some deterioration before we get too bearish.
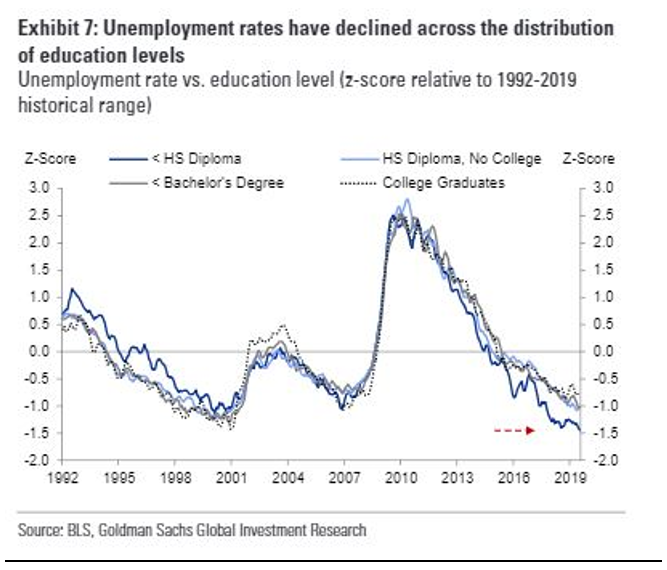
Based on the above charts, the consumer seems stable to me and that should mean spending is stable and with 72% of GDP reliant on spending, the math just doesn’t seem to indicate a recession is near. That’s a disconnect from current conventional wisdom. When people realize this, they may just add back some of those equities, which is a big catalyst ahead.
Here’s an un-emotional way to deal with the markets and measure a bull trend versus a bear trend so we don’t get sucked into the media-driven negative vortex:
Have a plan for de-risking, particularly when the bull market is actually over. How do we know the bull market has finally ended and a bear market has now begun? The answer is we never know with 100% confidence but historically there’s one measure that’s been a pretty good “line in the sand” mark. Below I have posted a chart of the S&P 500 going back to 1990 with a purple line denoting the 200-week moving average. As you can see, the 200-week line is a decent level to assess the difference between a correction in a bull market and a bear market beginning. As you can also see, the really bad things happen once the market breaks down from the 200 week level, currently around 2503 on the S&P. Lets roll through some volatility, pick our spots to add when great brands go on sale and pivot to bigger safety if we go into confirmed bear market territory and block out the doom and gloom, it rarely helps you make money.
DISCLOSURE:
This information was produced by and the opinions expressed are those of the author as of the date of writing and are subject to change. Any research is based on the author’s proprietary research and analysis of global markets and investing. The information and/or analysis presented have been compiled or arrived at from sources believed to be reliable, however the author does not make any representation as their accuracy or completeness and does not accept liability for any loss arising from the use hereof. Some internally generated information may be considered theoretical in nature and is subject to inherent limitations associated therein. There are no material changes to the conditions, objectives or investment strategies of the model portfolios for the period portrayed. Any sectors or allocations referenced may or may not be represented in portfolios managed by the author, and do not represent all of the securities purchased, sold or recommended for client accounts.