

Structured annuities are a category within annuities that have gone from zero to $12 billion dollars in annual issuance over the last nine years. Structured annuities are also known as buffered annuities, indexed variable annuities, and index-linked variable annuities. The category was created by AXA[1] in 2010 with the title Structured Capital Strategies. Since then, several competitors have entered the space. In the following blog post, I’d like to discuss how these products are constructed and how they’re priced.
Structured annuities are popular due to their balance of protection and upside, achieved by protecting a portion of downside in return for participation in the upside. Investors have the flexibility to decide how much downside relative to how much upside and that’s why it’s a category killer. Prior to Structured annuities, participants could either purchase full protection through indexed or traditional annuities, though with minimal upside (especially in today’s low interest rate environment) or potentially take on full downside risk in the form of variable annuities. Structured annuities do a nice job filling in the gap between fixed indexed annuities and variable annuities in regards to market exposure and protection, while still providing a high level of definition as to exposure. That said, I’m going to discuss the segment portion of the contract of this annuity which is the equivalent of a structured note. The general components of a segment is a bond, a portfolio of options and a fee.
Let’s use an example to really dig in and go under the hood on this structured annuity, which has a one-year 10% buffer with a cap of 7% on the S&P 500. This means, you have a one-year maturity on the product based on the S&P 500. The 10% buffer means you receive protection from the first 10% decline of the S&P 500 from time of inception to maturity. The cap of 7% means that you could capture up to 7% on the upside from time of entry until maturity.
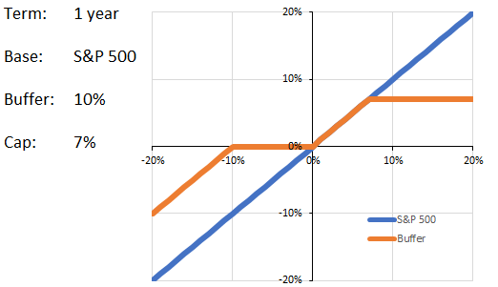
Figure 1: Example of a Structured Annuity with a 10% buffer with a cap of 7% on the S&P 500.
How is it constructed?

Figure 2: Example of pricing for a one year 10% buffer with a 7% cap on the S&P 500
First, a zero-coupon bond (in this example, a one-year bond) is held under the hood of the segment. Let’s assume the bond has a 2.5% yield when issued. So, if you think about the bond component, if you have 100 cents to spend, 97.5 cents are spent on that zero-coupon bond. That means we have two and a half cents left to spend. Currently on a one-year segment it’s worth 97.5% of the note and over that one-year period that bond will accrete to par; therefore, it will accrete to 100 cents on the dollar.
Regarding fees, some competitors state there’s no fee on the annuity and while it’s technically true, we all know that these are for-profit companies. So, there must be a fee, somewhere right? Let’s say there’s a 1.5% fee; the bond was 97.5% you have a fee of 1.5% that’s 99, now you have 1% to spend on the portfolio of options.
Let’s now work through the option portfolio. So, this might be a little bit counterintuitive but that 10% buffer on the downside is the issuer selling a put, selling exposure on the downside. It’s important to understand that these products do not own the S&P 500. There’s no exposure to the S&P 500 for the first 10% of losses from the original entry price and then below 10% that short put results in losses. For example, if the market is down 20, you will lose 10. The issuer receives money for selling a put, so if that put cost 3% you now have 4% left to spend on the upside (1% credit after spending on the bond and fees plus 3% credit for selling the put). Then what the issuer does is price out a call spread. A call spread provides upside exposure to the S&P 500 up to the cap; the long call provides exposure up and the short call above caps it. In this instance, a 7% call spread will cost 4%. That means that the segment will participate on the first 7% of the upside of the S&P 500 from time of entry and then will capped.
If the market is between “flat” and down 10% at the end of the term, the client will receive back 100% of their investment. All the options would expire worthless, but the zero-coupon bond would accrete to 100. Below 10%, the client would lose 1:1 with the market as the short put (buffer) would lose value. If the market is up considerably, the client would participate on the first 7% move. Note that the investor will not capture the dividend, so one needs to compare to the price return of the S&P 500 not the total return.
Understanding how structured annuities are built, and the fees involved are the only way to truly understand the risks and rewards of these products. In my next blog post, I’ll discuss the benefits and detriments of these products. I will compare the one-year and the five-year offerings, and which one offers more benefits for investors.
This content is also available in video format on Catalyst Insights:
https://catalyst-insights.com/options-expert-looks-under-the-hood-of-structured-annuities/