Is “buy and hold” always the best way to invest? It is common to see increasing numbers of articles touting the benefits of “armchair” investing during long bull market advances. The last decade has been a boon for the index ETF industry, financial applications, and media websites promoting “buy and hold” investing and diversification strategies.
But is the “best way to invest” during a bull market also the best way to invest during a bear market? Or, do different times call for different strategies?
Such are the questions we will explore.
The Premise Of Buy & Hold Investing
The premise of “buy and hold” investing is sound, particularly for younger investors. Place money into an index fund regularly (dollar cost average), and over a long period, wealth will compound. A look back over the last 120-years clearly shows the value of the thesis.
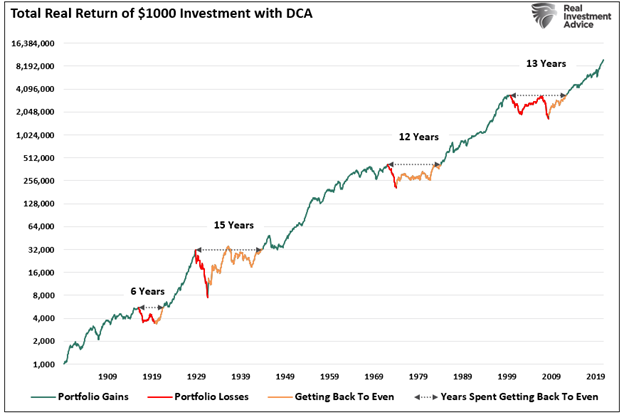
It is worth noting there are periods where markets fail to grow. As shown, such is due to the impact of valuations on future market returns.
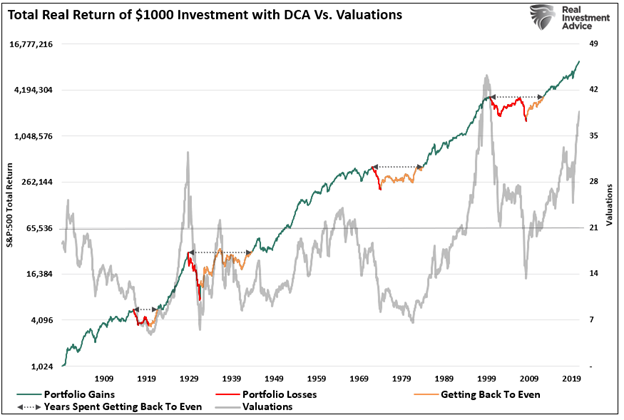
While “buy and hold” does seem to solve the problem of “bear market cycles” by “riding out” the volatility, there are three critical facets often overlooked.
- Diversification does not always work,
- The destruction of the “power of compounding;” and,
- The reduction of time needed to reach financial goals.
Diversification Doesn’t Always Work
The idea of diversification was derived initially from Harry Markowitz’s seminal work on what has become known as “Modern Portfolio Theory.”
“Modern portfolio theory (MPT), or mean-variance analysis, is a mathematical framework for assembling a portfolio of assets such that the expected return is maximized for a given level of risk. It is a formalization and extension of diversification in investing, the idea that owning different kinds of financial assets is less risky than owning only one type. Its key insight is that an asset’s risk and return should not be assessed by itself, but by how it contributes to a portfolio’s overall risk and return. It uses the variance of asset prices as a proxy for risk.” – Investopedia
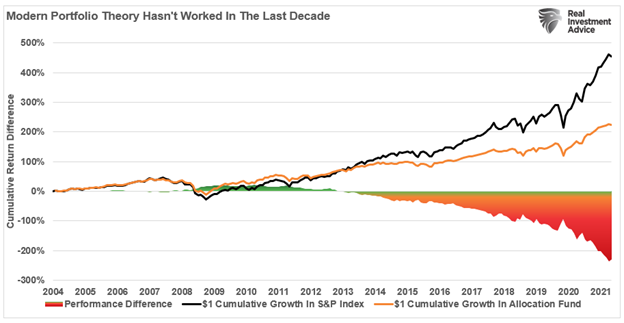
The essential premise is that holding a basket of diversified assets is less “risky” and provides better returns than owning just one asset, such as the S&P 500. The theory worked well during the last century when various asset classes did not maintain a high correlation. However, with advances in technology, transaction speeds, and information flows, correlations rose at the turn of the century. The chart below compares an S&P 500 Index Fund to a Global Asset Allocation fund.
From 2000 through 2007, allocation funds provided comparable performance to just owning an S&P 500 index fund. However, where the test of MPT failed was in 2008. While the allocation fund did lose slightly less than the S&P 500 index, the damage to capital was quite severe. Moreover, the performance gap compounded over the next decade as international and emerging markets markedly underperformed domestic equity and provided a minimal reduction in volatility.
The Promise Of 8% Returns
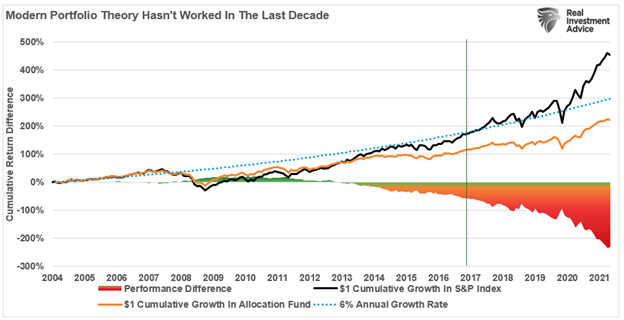
However, simply comparing the performance between the two funds is misleading. We must also tie back the performance to the returns required, or instead promised, to meet financial goals.
Since 2004, the allocation fund never achieved the promised growth rates of 8% annualized. The S&P 500 index didn’t accomplish that goal until 2017.
Importantly, it took over $43 trillion in financial interventions to create an asset bubble of a size never before witnessed in history. For investors, what has made the difference between reaching their financial goals or not, was a conscious decision to be entirely allocated to domestic equities and leave MPT behind.
The law of change states:
“Change will occur, and the elements in the environment will adapt or become extinct, and that extinction in and of itself is a consequence of change.”
Sometimes the “best way to invest” is to understand that market dynamics change. As investors, it is critically important to understand the causes of changes.
- Are the change permanent or driven solely by temporary factors?
- Do the factors driving those changes have other consequences that will affect future returns?
- Does the influence of these factors, either temporary or permanent, require a change to model allocation design?
- Can I adequately compensate for these changes using traditional investment assets?
- How will these changes affect my personal investment time horizon and financial goals.
The problem with MPT, and its use by the financial industry to sell products or services, is that it is not a stagnant, one-size-fits-all solution. Instead, as we should all be aware by now, the financial markets are constantly growing and evolving.
Therefore, logic suggests that our investment approach and allocations must also evolve or become “extinct.”
Time Horizons Matter
As noted, while “buy and hold” investing is the “best way to invest” during a bull market, there is a generally unrecognized problem with it during market declines.
We previously discussed Morningstar‘s analysis suggesting market declines don’t matter. One of the critical issues with the analysis was the exclusion of “life expectancy.” When discussing long periods of “no return” from markets, the impact of “time” becomes a critical factor. (The ordinary mortal doesn’t have 120-years to invest.)
To calculate REAL, TOTAL RETURN, we must adjust the total return formula by including “life expectancy.”
RTR =((1+(Ca + D)/ 1+I)-1)^(Si-Lfe)
Where:
- Ca = Capital Appreciation
- D = Dividends
- I = Inflation
- Si = Starting Investment Age
- Lfe = Life Expectancy
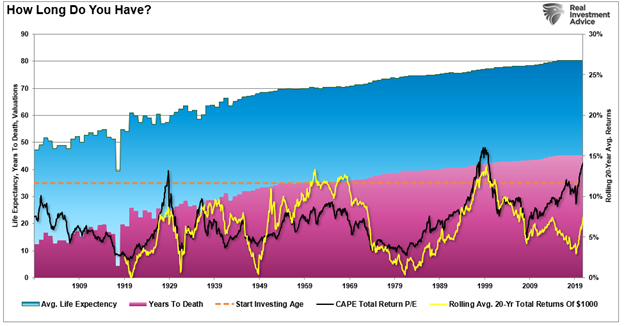
We assume that most individuals get serious about saving and investing around the age of 35. (Have graduated college, started a career, bought a home, have kids.) We also consider the holding period for stocks is equal to the life expectancy less the starting age. The chart below shows the calculation of total life expectancy (based on the average of males and females) from 1900-present, the average investment starting age of 35, and the resulting years until death. I have also overlaid the rolling average of the 20-year total, real returns, and valuations.
The Destruction Of Compounding
One of the significant problems with market declines is the destruction of the compounding effect of money.
We will use a simple mathematical example.
Assume an investor wants to compound returns by 10% a year over 5-years.
“The ‘power of compounding’ ONLY WORKS when you do not lose money. As shown, after three straight years of 10% returns, a drawdown of just 10% cuts the average annual compound growth rate by 50%. Furthermore, it then requires a 30% return to regain the average rate of return required.” – The One Chart Every Millennial Should Ignore
The stock market does not COMPOUND returns.
When imputing volatility into returns, the differential between what investors were promised (which is a massive flaw in financial planning) and what happens is substantial over long-term time frames.
Average And Actual Returns Are Not The Same
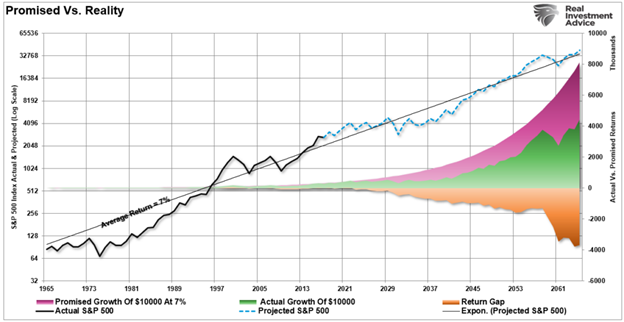
There is a massive difference between AVERAGE and ACTUAL returns on invested capital. Thus, in any given year, the impact of losses destroys the annualized “compounding” effect of money.
The chart below shows the difference between “actual” investment returns and “average” returns over time. See the problem? The purple shaded area and the market price graph show “average” returns of 7% annually. However, the return gap in “actual returns,” due to periods of capital destruction, is quite significant.
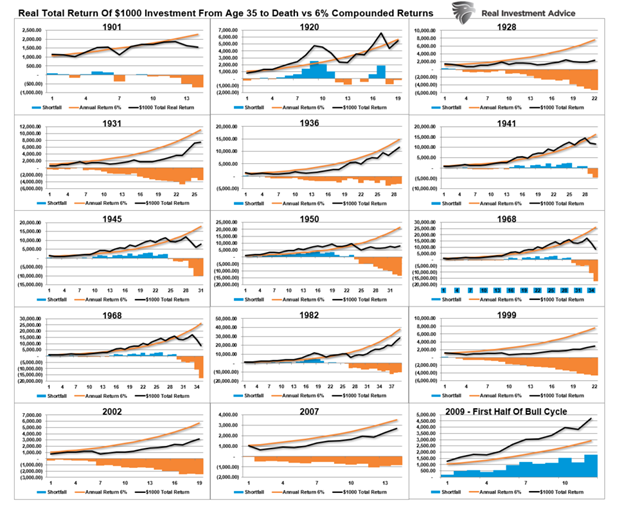
In the chart box below, I have taken a $1000 investment for each period and assumed the total return holding period until death. There are no withdrawals made. (Note: the periods from 1983 forward are still running as the investable life expectancy span is 40-plus years.)
The orange sloping line is the “promise” of 6% annualized compound returns. The black line represents what happened with invested capital from 35 years of age until death. At the bottom of each holding period, the bar chart shows the surplus, or shortfall, of the 6% annualized return goal.
At the point of death, the invested capital is short of the promised goal in every case except the current cycle starting in 2009. However, that cycle is yet to be complete, and the next significant downturn will likely reverse most, in not all, of those gains. Such is why using “compounded,” or “average” rates of return in financial planning often leads to disappointment.
Buy And Hold Works, Until It Doesn’t.
As stated, “buy and hold” investing works well during strongly trending market advances. Given enough time, the strategy will endure the eventual market downturn. However, three key considerations must get considered when endeavoring into such a strategy.
- Time horizon (retirement age less starting age.)
- Valuations at the beginning of the investment period.
- Rate of return required to acheive investment goals.
Suppose valuations are high at the beginning of the investment journey. In that case, the time horizon is too short, or the required rate of return is too high, the outcome of a “buy and hold” strategy will most likely disappoint expectations.
Mean reverting events expose the fallacies of “buy-and-hold” investment strategies. The “stock market” is NOT the same as a “high yield savings account,” and losses devastate retirement plans. (Ask any “boomer” who went through the dot.com crash or the financial crisis.”)
Therefore, during periods of excessively high valuations, investors should consider opting for more “active” strategies with a goal of capital preservation.
Important Points All Investment Strategies Should Consider
Before engaging in a “buy and hold” investment strategy, the analysis reveals essential points to consider:
- Investors should downwardly adjust expectations for future returns and withdrawal rates due to current valuation levels.
- The potential for front-loaded returns in the future is unlikely.
- Your life expectancy plays a huge role in future outcomes.
- Investors must consider the impact of taxation, inflation, and current savings rates.
- In a world where markets are highly correlated, MPT is likely not effective in portfolio allocation strategies.
- Drawdowns from portfolios during declining market environments accelerate principal destruction. Plans should be made during up years to “safe harbor” capital for reduced portfolio withdrawals during adverse market conditions.
- Over the last 12-years, the yield chase and the low rate environment have created a hazardous environment for investors. Investment strategies should accommodate for rising volatility and lower returns.
- Investors MUST dismiss expectations for compounded annual return rates in place of variable rates of return based on current valuation levels.
There is no “one best way to invest.”
Every investor must account for the myriad of variables that will impact their investment returns and financial goals over time. Most importantly, investors must realize that surviving the eventual bear market is more important than chasing the bull market.
The “best way to invest” is the process of navigating the entire market cycle between when you start investing and when you need your capital.
“Buy and hold” strategies are the “best way” to invest until they aren’t.
Just make sure you know where you are within a given market cycle to increase your odds of success.

