

Key Summary:
- Through the pandemic, consumer spending went parabolic and has now mean reverted.
- Spending behavior changed and brand loyalty & consumption trends remain lumpy.
- The narrative today is “consumers are struggling”. The truth is more nuanced.
Very Important thesis: If equities generate roughly 8-10% a year over time, leading brands serving the dominant driver of the economy, in theory, should compound at 12-15%+ over time. We have significant proof on this topic. In a world where rates and inflation are higher than we might like, business models with pricing power, exposure to quality factors, and that generate strong profits and free cash are set up to win versus the typical peer. Brands Matter.
Consumer Spending & Retail Sales in General are Now Back to Normal Levels.
Mean reversion is one of the most powerful and predictable phenomena inside markets. When something gets stretched to an extreme relative to the long-term linear trend, either up or down, it tends to head back towards the normal levels. Understanding this, offers some significant investment opportunities. I’ve talked about the concept of consumer behavior changing and then staying on the new course versus mean reverting before. When I look at today’s consumer spending trends and the monthly retail sales data, it reminds me of many of the trends we spotted early that are still prevalent today.
In the early part of the pandemic, goods were favored over services like eating out via fast casual, along with travel & experiences, not because we loved goods more but because we had no ability to experience normal life. The longer that trend persisted, the more acute our desire to have experiences became. Our view was that this experience would change how consumers viewed life experiences and we would place them at a premium versus basic goods. With the difficulty in large parts of the goods-sector, and robust levels of services and experiences consumption today, I think our analysis was pretty good on this topic. We still see higher for longer demand for in-demand services, eating out, travel and experiences and have positions across many leading brands in this category. These stocks are hitting new highs almost every day.
Consumer Spending Habits Have Changed Since 2019. Some are Very Sticky.
E-commerce is a key focus for every consumer company these days. It was the fastest growing component of retail sales pre-2019 but it has accelerated since. While some mean reversion was to be expected, e-commerce now accounts for almost 16% of total U.S. Retail Sales, which is up from about 10% in 2019. Consumers were forced to order things online and largely the experience was pleasant. When a brand like Amazon (the largest e-commerce brand in the world) spends aggressively to build an even bigger and better logistics infrastructure which ultimately doubles revenue in 3 years, consumers won because we got to save time, save money, and gain convenience. We continue to believe Amazon retail margins have further room to expand adding significant operating leverage to the business. These gains can then flow into AI spend for their AWS and AI initiatives which have high ROIs expected. A powerful 1-2 punch for this brand in our opinion.
Because we are focused on saving money, and have changed how we spend, while consolidating the number of brands we favor today, one should expect consumer spending to be less broad and lumpier quarter/quarter. Yes, consumers are tightening their belts in many areas, but they are also spending well in “favored areas”. It’s the lowest quartile of consumers that are struggling the most with higher prices. Roughly 30% of our economy is in this cohort, so as stock pickers, we need to be mindful when investing in brands that serve this cohort. We see their struggles manifesting in higher delinquencies in credit cards and auto loans, but this is largely contained to 1/3 of the population. Many of these datapoints though, are simply rising back to longer term averages. Something to watch though. These are the consumers leaning into brands like Costco, Walmart, TJX, etc.
Today’s Narrative: Consumers are Struggling and/or Consumers are Tapped Out.
The punchline: There is a massive amount of “tappable cash” available to consumers today. So long as incomes and jobs hold up, spending will be stable. Below, I show some charts and data that should give you some idea where consumers stand broadly. That data should help you understand how stable the consumer spending trends are, even while being lumpy month to month and income cohort to cohort. By the way, remember, about $80 trillion is just beginning to trickle down to GenX and Millennials from older family members, this will be a silent X-factor to spending capacity over the next 3 decades. Also remember, when someone shows you the chart of Retail Sales Falling, there is ZERO correlation between the direction of Retail Sales and stocks. I’ve done the work. It surprised me too.
The following consumer charts come from a great blog by Ben Carlson, CFA who is a PM at Ritholtz Wealth Management.
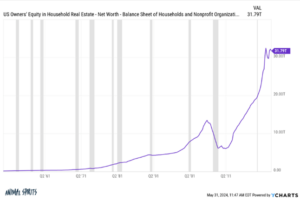
U.S. homeowner’s “tappable” home equity is roughly $16 TRILLION, IF they needed it. $32T total, with the assumption that half is tappable.
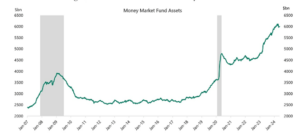
Money Market Assets: Roughly $6 trillion that has just begun to trickle into the equity markets.
Cash invested in CD’s, Savings accounts and short-term instruments: Another $2-3 Trillion.
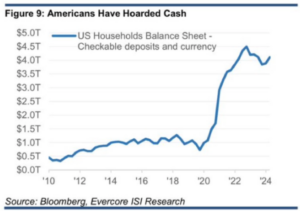
Cash in Checking Accounts: Roughly $4 trillion can be tapped if they need cash.
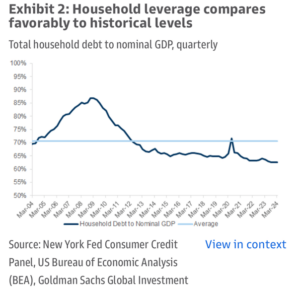
Some great Goldman Sachs charts:
Household Leverage is LOW & speaks to a consumer’s ability to borrow and spending capacity.
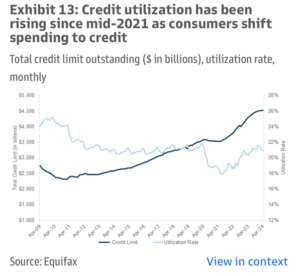
Credit utilization has risen over the last 2 years but is only back to “normal” levels.
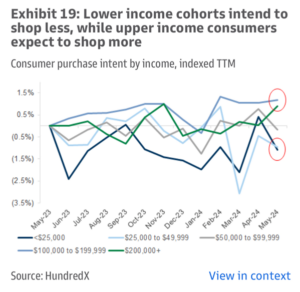
Spending intentions vary by income cohort. $100k+ incomes intend to keep spending as normal or accelerate spending. This is key to our stock selection.
Important Disclosure: The above data is for illustrative purposes only. This information was produced by Accuvest and the opinions expressed are those of the author as of the date of writing and are subject to change. Any research is based on the author’s proprietary research and analysis of global markets and investing. The information and/or analysis presented have been compiled or arrived at from sources believed to be reliable, however the author does not make any representation as their accuracy or completeness and does not accept liability for any loss arising from the use hereof. Some internally generated information may be considered theoretical in nature and is subject to inherent limitations associated therein. There are no material changes to the conditions, objectives or investment strategies of the model portfolios for the period portrayed. Any sectors or allocations referenced may or may not be represented in portfolios managed by the author, and do not represent all of the securities purchased, sold or recommended for client accounts. The reader should not assume that any investments in sectors and markets identified or described were or will be profitable. Investing entails risks, including possible loss of principal. The use of tools cannot guarantee performance. The charts depicted within this presentation are for illustrative purposes only and are not indicative of future performance. Past performance is no guarantee of future results.