Happy Holidays!
The best returns tend to come from buying great assets AFTER periods of underperformance.
Key Summary:
- Our 2024 Top 200 Brands Index reconstitution is complete. New ideas incoming.
- The past 2 years have been difficult for most stocks & bonds. Mean reversions ahead.
- Highly relevant, dominant brands have significant growth ahead. You haven’t missed it.
2024: Our investment universe gets upgraded each year to reflect new brand opportunities.
To track a powerful theme like global consumer spending & business investment, a superior investment universe of great brands is required. Each year, in early December, our team goes through a rigorous research process to uncover emerging brands and important consumption themes. We are excited to show you our 2024 investment universe of iconic and emerging brands. For 2024, we replaced 25 companies to add new, exciting brands and important consumption categories that are driving global growth. Here’s the link to the Alpha Brands Consumer Spending Index page:
The 2 Year Stack Highlights How Difficult Markets Have Been Through Pandemic Distortions.
Sometimes, investors over-complicate the investment process. It’s important to remember to start with the long-term returns shown by markets and compare them to the shorter-term experience. This comparison can often highlight how much or little exposure could be warranted for the forward 12+ months.
Facts: If equities generate roughly 8-10% a year over time, the leaders of industry should, in theory, compound at 13%+ over time. We have significant proof on this topic where top brands are concerned. For a variety of reasons, the last few years has been difficult for the average stock. Betting against consumption-focused stocks after a massive outlier event that created a significant amount of distortions (now normalizing) has been a poor investment decision. We see massive opportunity across the consumption landscape as great companies play catch-up to reach more typical annualized return metrics.
How? The pandemic, and the interest rate and inflation shock created by it, are well on their way to normalizing. Companies across every industry were forced to right-size operations and streamline and relocate supply chains. And AI is coming to every company in one shape or another. That has powerful additional implications over time. Better operating metrics, zero-complacency across top management teams, and market share gains in tough times tends to pay multi-year dividends for leaders in important industries.
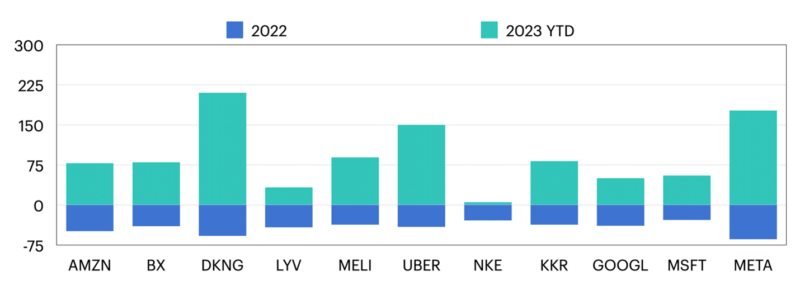
The leading brands have only gotten stronger over the last 3 years, yet their stocks have stagnated with the overall market for 2 years. Below, I highlight 11 key mega brand leaders and show their 2022 and 2023 returns to illustrate what an over-reaction the difficult year of 2022 was. How could we not get excited when we saw such silly drawdowns across great brands? 2023’s returns highlight the power of being opportunistic when markets act irrationally. (Performance data is through 12/15/2023).

Source: YCharts.
The Next Few Years Could Be Better Than You Expect.
Even after this year’s recovery, I see very little evidence of excitement for stocks. Yes, the AAII individual investors report saw a resurgence of bullishness lately as markets have ripped higher but it’s important to remember to follow what investors do, versus what they say. Only in the last week have we seen large inflows to equities as a chase for performance happens. Yes, markets are short-term overbought, and a sideways or choppy market could occur as we digest recent gains. I speak to Advisors and fund/ETF wholesalers almost daily, and I can say with certainty that portfolios are under-exposed to equities and interest currently is still just emerging from a 2-year nap. Additionally, there’s still trillions in money market funds earning less as rates trend lower. Bottom line: there’s plenty of fuel to drive the equity and bond markets higher in 2024 even if we see the typical VOL in short periods of time. I urge you to use this VOL to your advantage and add to your favorite styles and thematics, like the global consumer and Brands.
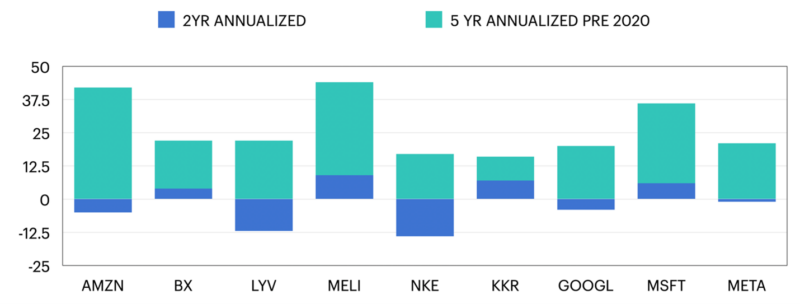
To illustrate the opportunity, I have posted a chart showing 11 key brands and their 2-year annualized return versus the 5-year average annualized return ending 1/2020 just before the pandemic began distorting markets. Yes, rates and inflation are higher now, but the smartest companies have transformed their businesses to be much more resilient and that should translate into a “better for longer” operating metric environment. Bottom line: Savvy investors buy great businesses when they have compounded much less than they typically do over the long-term. If a leading business is still highly relevant and their operating metrics are improving yet the stock has languished, that’s typically a great opportunity.
You haven’t missed it, use any weakness to build bigger positions in smart, logical strategies like global consumption. There’s plenty of gas left in the tank across the industries and brands we cover.

Source: YCharts.
Note: Our team and brand strategies may or may not own the above brands now or in an ongoing basis, the graphics are meant to be an illustration of the 2 year vs 7 year period in stocks.
Disclosure: The above report is a hypothetical illustration of the benefits of using a 3-pronged approach to portfolio management. The data is for illustrative purposes only and hindsight is a key driver of the analysis. The illustration is simply meant to highlight the potential value of building a consumption focused core portfolio using leading companies (brands) as the proxy investment for the consumption theme. This information was produced by Accuvest and the opinions expressed are those of the author as of the date of writing and are subject to change. Any research is based on the author’s proprietary research and analysis of global markets and investing. The information and/or analysis presented have been compiled or arrived at from sources believed to be reliable, however the author does not make any representation as their accuracy or completeness and does not accept liability for any loss arising from the use hereof. Some internally generated information may be considered theoretical in nature and is subject to inherent limitations associated therein. There are no material changes to the conditions, objectives or investment strategies of the model portfolios for the period portrayed. Any sectors or allocations referenced may or may not be represented in portfolios managed by the author, and do not represent all of the securities purchased, sold or recommended for client accounts. The reader should not assume that any investments in sectors and markets identified or described were or will be profitable. Investing entails risks, including possible loss of principal. The use of tools cannot guarantee performance. The charts depicted within this presentation are for illustrative purposes only and are not indicative of future performance. Past performance is no guarantee of future results.[/vc_column_text][/vc_column][/vc_row]

