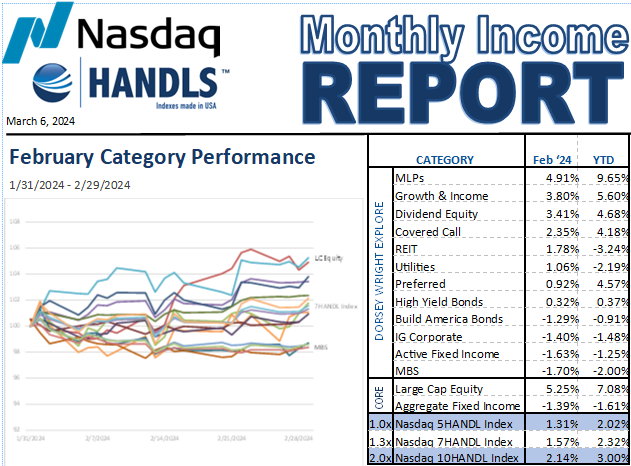
The graph and table above provide return data for major income-oriented asset categories for the month of February 2024 and YTD 2024. Returns for each asset category are based on the returns of the constituent(s) in the Nasdaq HANDLS™ Base Index representing that category. Also included are returns for the Nasdaq 5HANDL™ Index, the Nasdaq 7HANDL™ Index and the Nasdaq 10HANDL™ Index.
Equity Runs; Fixed Income Falters
Much like the Las Vegas Hotel on the Strip that appears to be right next door, investors are discovering in 2024 that interest rate cuts are farther away than they seem. The chief impediment to lower rates remains persistent inflation, which has yet to fall to the Federal Reserve’s 2% annual target.
In mid-February, the Bureau of Labor Statistics reported that the Consumer Price Index (CPI) 12-month inflation rate dropped to 3.1% at the end of January after clocking in at 3.4% in the 12 months ending in January. Nevertheless, inflation for January came in at 0.3%, up from 0.2% in December and above analyst expectations, raising concerns that the Federal Reserve is losing ground in its inflation fight. Despite mortgage rates hovering around 7%, shelter prices significantly contributed to the CPI increase, gaining 0.6% in January.
While the CPI receives more attention from the financial media, the Federal Reserve prefers the Commerce Department’s personal consumption expenditures price index, excluding food and energy costs (core PCE), as an inflation barometer. Released on the last day of February, core PCE grew at 0.4% for January and 2.8% for the 12 months ending in January. Headline PCE (including food and energy costs) came in at 0.3% and 2.4%, respectively, for the month and 12-month period.
On the bright side, the persistent inflation reflects an economy that continues to fire on all cylinders. After a red-hot reading of 4.9% in the third quarter of 2023, real gross domestic product grew at an annualized rate of 3.3% in the fourth quarter. With growing wages and job growth, consumers are responding by opening their wallets and spending with abandon. Meanwhile, productivity improvements driven partly by the implementation of Artificial Intelligence (AI) are providing tailwinds for the equity markets, particularly the technology sector.
The equity markets responded favorably to a slew of positive fourth-quarter earnings reports in February, while the fixed-income markets struggled with unfavorable inflation readings. The Core Large Cap Equity category returned 5.3% for the month, while the Core Fixed Income category lost 1.4%.
All equity categories that comprise the Nasdaq Dorsey Wright Explore portion of HANDLS Indexes delivered positive returns in February. High-yield Bonds were the only fixed-income category that did not lose ground. The MLPs category once again led the way with a 4.9% return, following on the heels of a 4.5% return in January and a 21.4% return in calendar year 2023. After a horrific performance run from 2015 through 2020 that saw many investors flee the category, the 10-year track record for MLPs is finally showing positive returns.

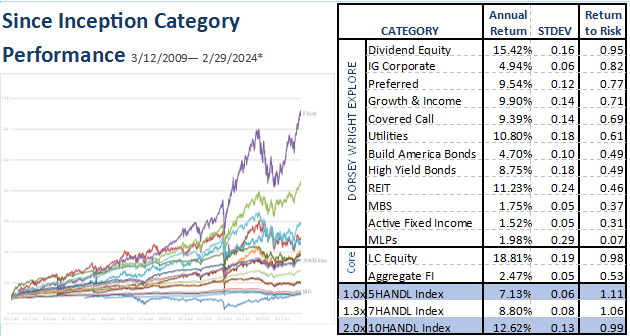
*The graph and table above provide return data for major income-oriented asset categories since inception of HANDLS Indexes (3/12/2009). Returns for each asset category are based on the returns of the constituent(s) in the Nasdaq HANDLS™ Base Index representing that category. Also included are returns for the Nasdaq 5HANDL™ Index, the Nasdaq 7HANDL™ Index and the Nasdaq 10HANDL™ Index. Inception dates for MLPs (1/2/2013), Build America Bonds (1/2/2010) and Active Fixed Income (1/2/2014)
Disclosure: Nasdaq® is a registered trademark of Nasdaq, Inc. The information contained above is provided for informational and educational purposes only, and nothing contained herein should be construed as investment advice, either on behalf of a particular security or an overall investment strategy. Neither Nasdaq, Inc. nor any of its affiliates makes any recommendation to buy or sell any security or any representation about the financial condition of any company. Statements regarding Nasdaq-listed companies or Nasdaq proprietary indexes are not guarantees of future performance. Actual results may differ materially from those expressed or implied. Past performance is not indicative of future results. Investors should undertake their own due diligence and carefully evaluate companies before investing. ADVICE FROM A SECURITIES PROFESSIONAL IS STRONGLY ADVISED. © 2024. Nasdaq, Inc. All Rights Reserved
Important Disclosure. HANDLS Indexes receives compensation in connection with licensing its indices to third parties. Any returns or performance provided within are for illustrative purposes only and do not demonstrate actual performance. Past performance is not a guarantee of future investment results. It is not possible to invest directly in an index. Exposure to an asset class is available through investable instruments based on an index. HANDLS Indexes does not sponsor, endorse, sell, promote or manage any investment fund or other vehicle that is offered by third parties and that seeks to provide an investment return based on the returns of any index. There is no assurance that investment products based on an index will accurately track index performance or provide positive investment returns.

