Drilling Down on Shale Depletion Rates

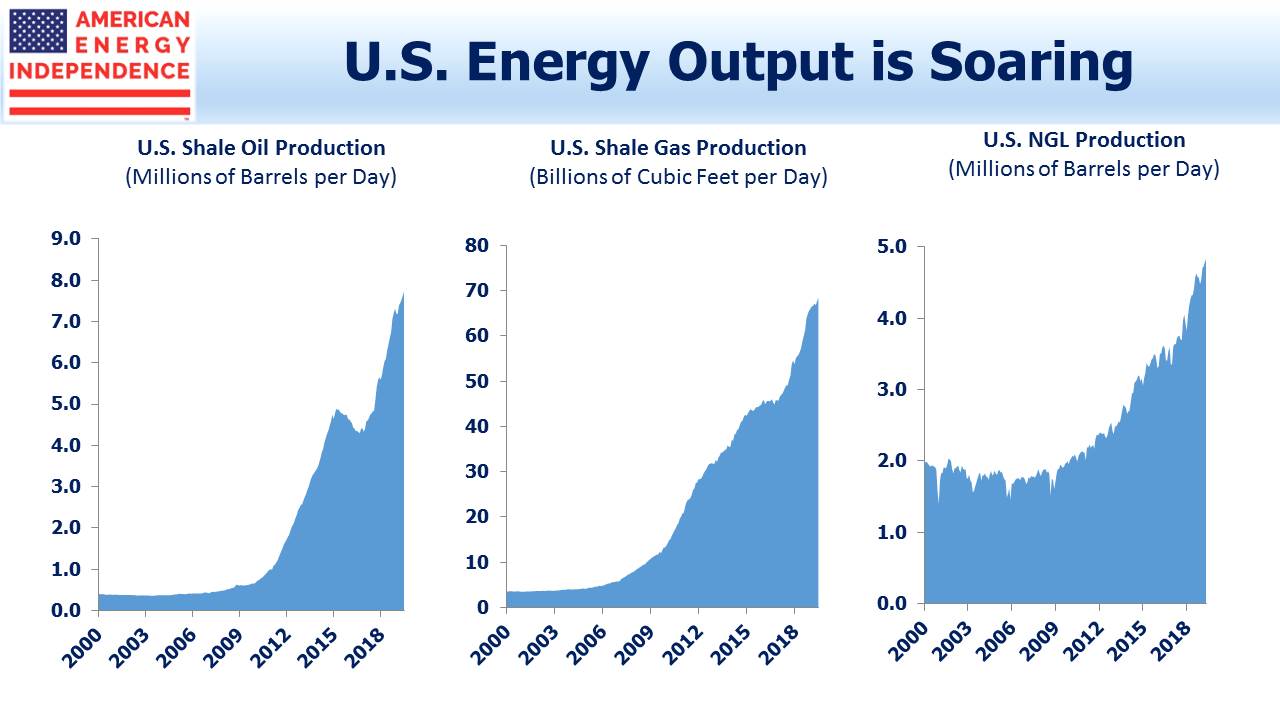
The Shale Revolution has substantially increased America’s output of oil, natural gas and natural gas liquids. We often use the chart below to highlight this exponential growth.

Those exponential curves are going to flatten, not only because nothing can rise that fast indefinitely, but also because of the high initial depletion rates of fracked wells.

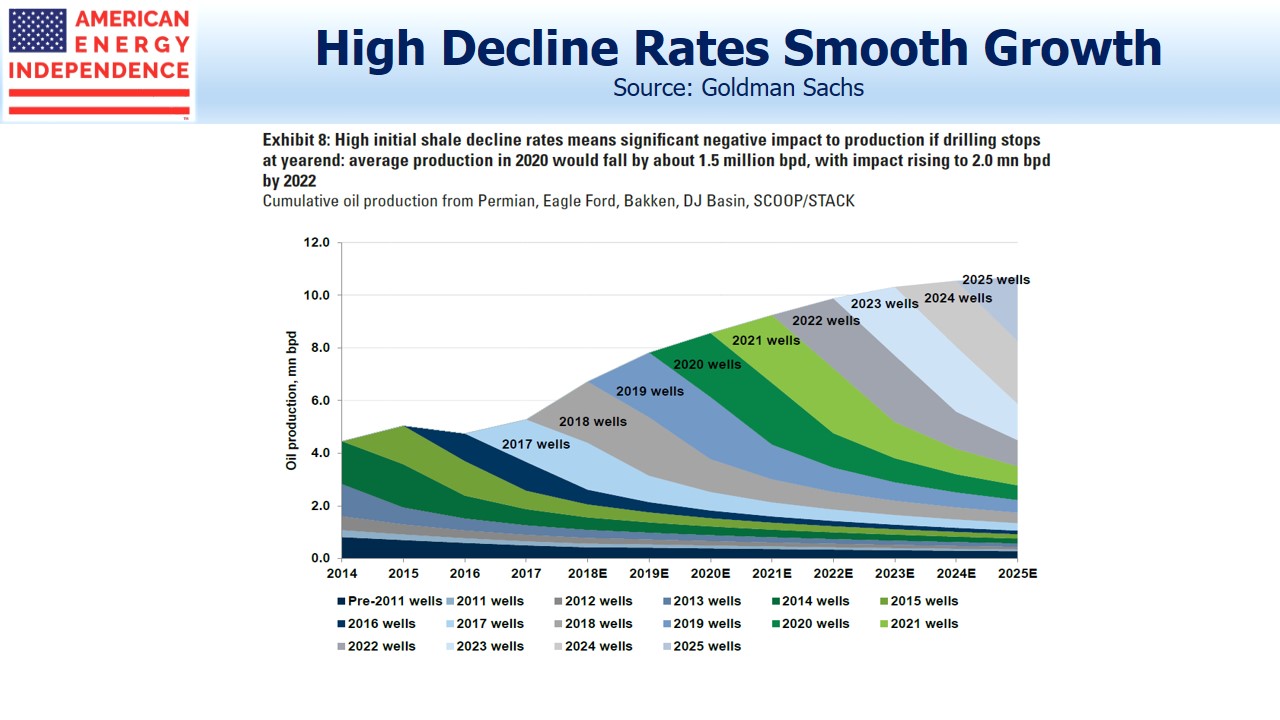
The chart above from Goldman Sachs provides a useful picture of shale oil production, which shows a gently flattening growth curve. It can be helpful to examine more closely how the lifecycles of cumulative wells combine to render growth ever harder to achieve.

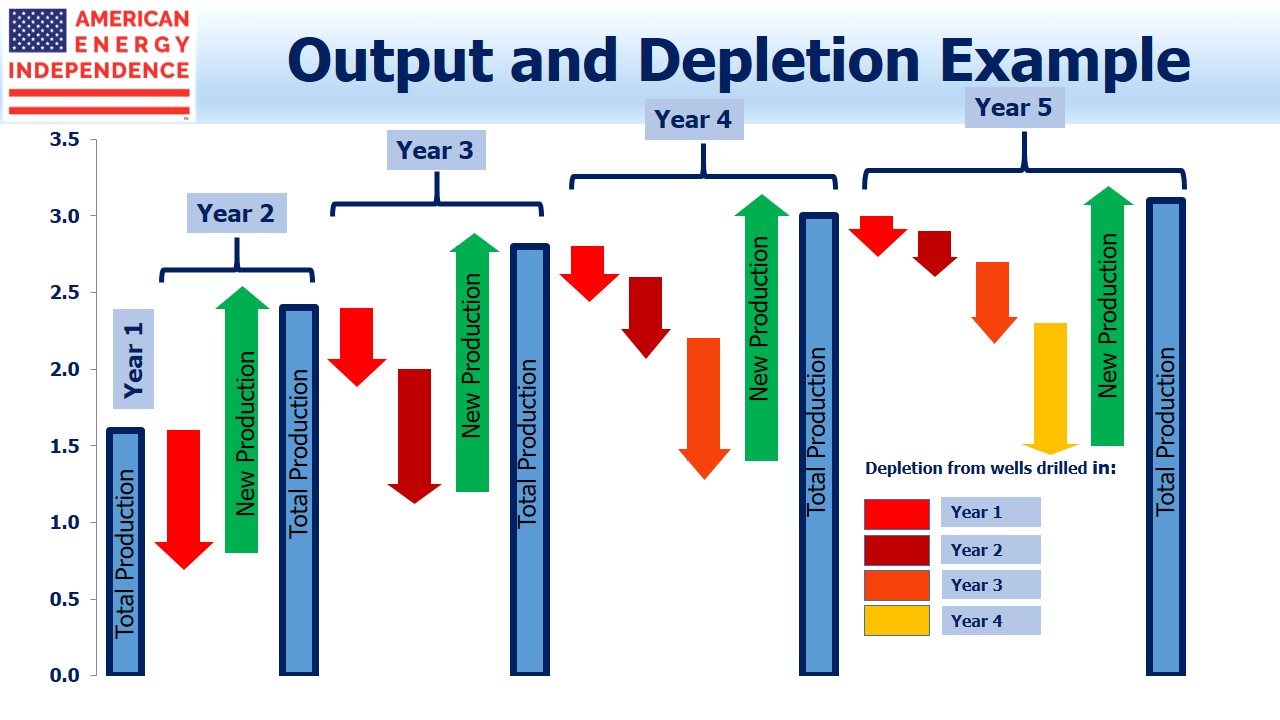
The chart below is a theoretical model, showing a shale oil play in which production drops at 50% annually from previously drilled wells, while at the same time new wells are fracked each year with initial production of 1.6 million barrels per day (MMB/D).

It’s a busy chart but worth a moment to examine carefully.

Year 1 production of 1.6 MMB/D experiences 50% depletion in Year 2, of 0.8 MMB/D. But new production of another 1.6 MMB/D raises Year 2 total productioln to 2.4 MMB/D, a 50% jump.

Follow the successive depletion arrows from Year 1 production through Years 3-5, and you’ll see that they’re joined by depletion from later years of production. By Year 5, depletion from the four prior years totals 1.5 MMB/D, almost negating that year’s new production.

This illustrates a fundamental advantage of “tight” oil over conventional production. Output can rise very quickly and capital is invested over time in successive wells. This creates the short-cycle feature since capital is recycled very quickly (see Shale Cycles Faster, Boosting Returns). Moreover, if prices drop in, say, Year 3 the E&P company in this example can simply stop drilling. Production quickly plummets, since New Production is at least half of Total Production.

The model is intended to provide a couple of insights. One is that after an initial ramp up, production has to flatten. The other is that production can quickly fall, and following an initial sharp recovery starts to plateau again. This is visible on the Goldman chart during the 2014-16 oil collapse.

Our model is simplistic to illustrate a point. Productivity continues to improve, technology enhancements are regularly found, and the most productive areas are often drilled first. These and other factors will all obscure the depletion effect illustrated.

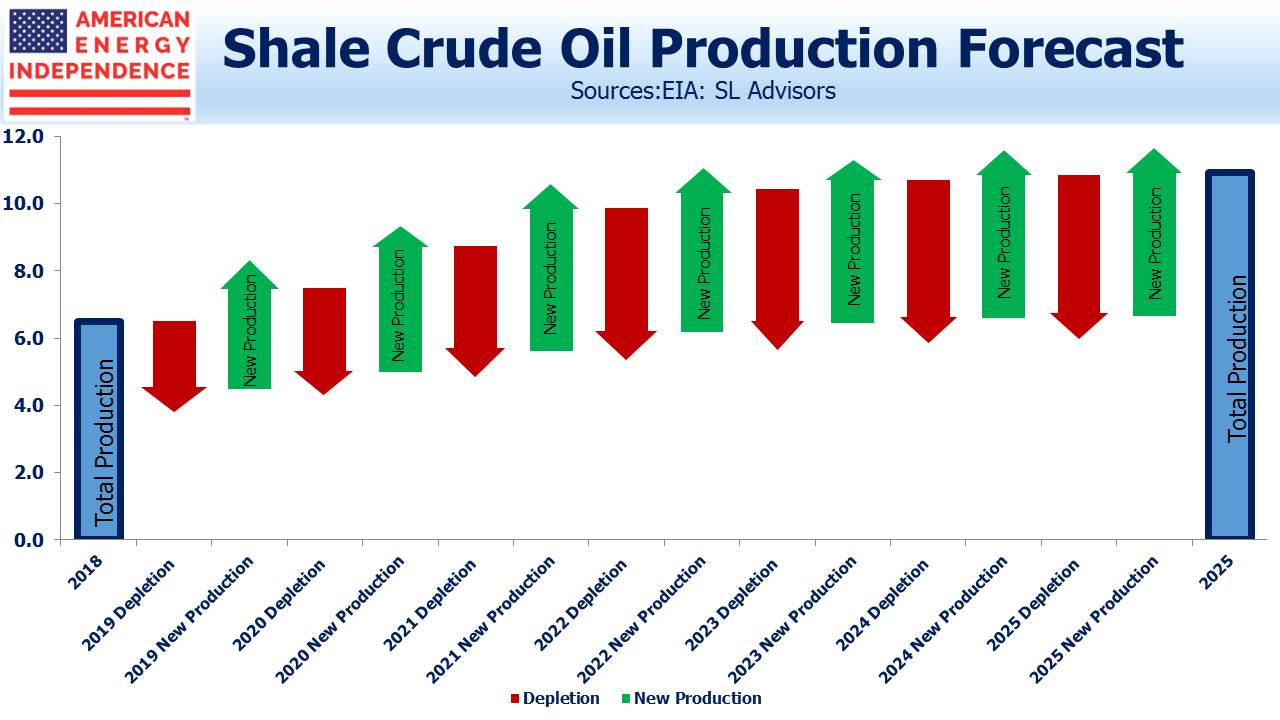
The chart above is an estimate of what we expect U.S. shale oil production growth to be from now until 2025.

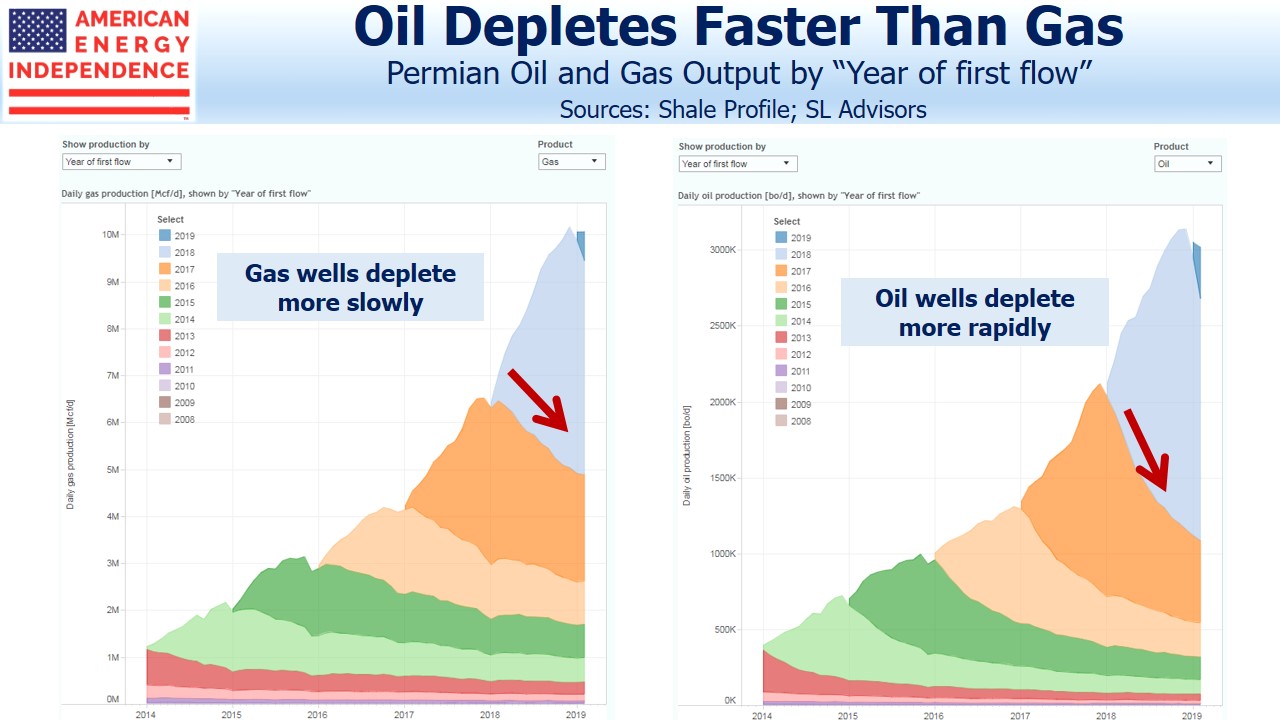
A final interesting note is that this depletion effect is much more pronounced with oil wells versus natural gas. Crude wells experience faster initial depletion. This tends to shift the Oil-Gas ratio in favor of the latter, and also means that the inexorable drag on total output caused by depletion is less pronounced for natural gas wells compared with crude oil. The pair of charts above illustrate this. It’s partly why natural gas output is likely to continue growing, keeping prices depressed. By contrast, growth in U.S. crude output is likely to moderate. This is net bearish for natural gas prices and bullish for oil.

If you missed our webinar last week, titled “Volumes, Cashflow and ESG”, here’s a link to a replay.

The post Drilling Down on Shale Depletion Rates appeared first on SL-Advisors.

Latest

Income Shines: November 2024 HANDLS Monthly Report

November proved to be a strong month for income-focused investments, with all sectors delivering positive returns despite market volatility.

Building a Winning Portfolio for Trump’s Second Term

Building a portfolio for a second Trump term means focusing on companies positioned to benefit from shifting regulatory priorities and trade dynamics.

David Miller on CNBC’s Market Navigator: Will Overheating Hurt Nvidia?

Will Mag 7 stock Nvidia beat estimates? David Miller, Co-Founder and Chief Investment Officer of Catalyst Funds, Rational Funds, and Strategy Shares, provided his insights to CNBC on Nov. 19 on why he believes the company will come out ahead this week despite potentially challenging headlines.

Chart of the Week: is the Stock Market Getting Ahead of Itself?

In October, Goldman Sachs strategists cautioned investors to be prepared for stock market returns during the next decade that are toward the lower end of their typical performance distribution.

Newsletter

Don't miss

Income Shines: November 2024 HANDLS Monthly Report

November proved to be a strong month for income-focused investments, with all sectors delivering positive returns despite market volatility.

Building a Winning Portfolio for Trump’s Second Term

Building a portfolio for a second Trump term means focusing on companies positioned to benefit from shifting regulatory priorities and trade dynamics.

David Miller on CNBC’s Market Navigator: Will Overheating Hurt Nvidia?

Will Mag 7 stock Nvidia beat estimates? David Miller, Co-Founder and Chief Investment Officer of Catalyst Funds, Rational Funds, and Strategy Shares, provided his insights to CNBC on Nov. 19 on why he believes the company will come out ahead this week despite potentially challenging headlines.

Chart of the Week: is the Stock Market Getting Ahead of Itself?

In October, Goldman Sachs strategists cautioned investors to be prepared for stock market returns during the next decade that are toward the lower end of their typical performance distribution.

What’s the Real Value of Active Management?

In my opinion, true active strategies have a very important role in portfolios as complements to passive, cheap beta. Advisors need to understand what they own.
Simon Lack, Portfolio Manager
Simon Lack is Founder and Managing Partner of SL Advisors, LLC. Mr. Lack is Portfolio Manager of an energy and infrastructure fund at Catalyst Capital Advisors LLC. Mr. Lack’s experience includes: Managing Director, JPMorgan Global Trading Division and CEO, JPMorgan Incubator Funds. Mr. Lack has authored The Hedge Fund Mirage: The Illusion of Big Money and Why It’s Too Good to Be True (January 2012) and Bonds Are Not Forever: The Crisis Facing Fixed Income Investors (September 2013).

Income Shines: November 2024 HANDLS Monthly Report

November proved to be a strong month for income-focused investments, with all sectors delivering positive returns despite market volatility.

Building a Winning Portfolio for Trump’s Second Term

Building a portfolio for a second Trump term means focusing on companies positioned to benefit from shifting regulatory priorities and trade dynamics.

David Miller on CNBC’s Market Navigator: Will Overheating Hurt Nvidia?

Will Mag 7 stock Nvidia beat estimates? David Miller, Co-Founder and Chief Investment Officer of Catalyst Funds, Rational Funds, and Strategy Shares, provided his insights to CNBC on Nov. 19 on why he believes the company will come out ahead this week despite potentially challenging headlines.