Since stocks began their massive rebound from the Global Financial Crisis in 2009, and particularly the years between 2016 and 2018, equity declines have been so sudden and limited that long-term trend following has not had enough time to re-position effectively.
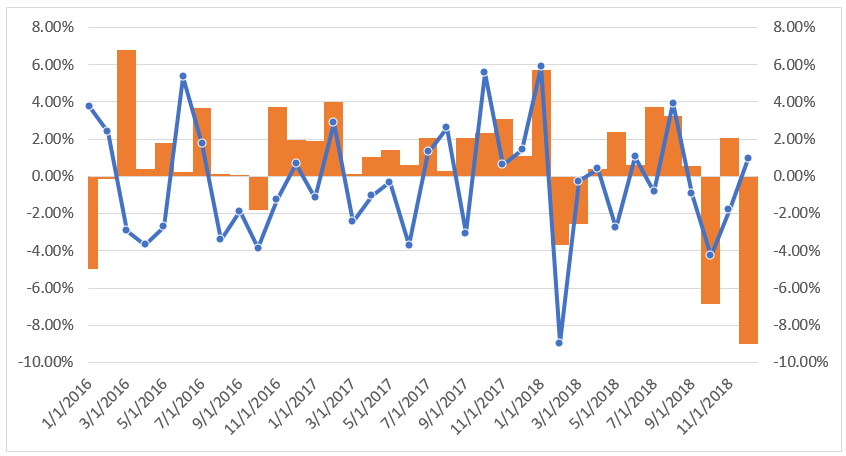
And where managed futures should have performed, they haven’t. The last time trend-following delivered was in early 2016 when the S&P 500 fell more than 5%. Unfortunately, this strategy did not provide crisis return for the tumbles that stocks saw in the first quarter and fourth quarter last year.
Trend Following CTA Index vs S&P 500 Monthly Returns 2016-2018 (Orange Bars: S&P 500, Blue Line: CTA Trend Following Index)

Source: Bloomberg
There is a way to potentially increase the likelihood of delivering returns that smooths out the volatility of the equity markets. The cost of hedging these days is so low that many methods can be cost efficient. In general, when the stock market declines, the price of option hedges increases, and this is widely reported nowadays in financial news as a rising VIX index. The VIX index tends to increase and the price of very near-term hedges increases more than hedges that are further into the future. For this, we look at the regular VIX index and the three-month VIX level that tends to be overlooked.
By using a simple rule, we can create a more efficient hedge strategy:
| What | When | |
| BUY | First VIX future | The VIX index rises to 90% or higher relative to 3-mo VIX level |
| SELL | First VIX future | This is no longer the case |
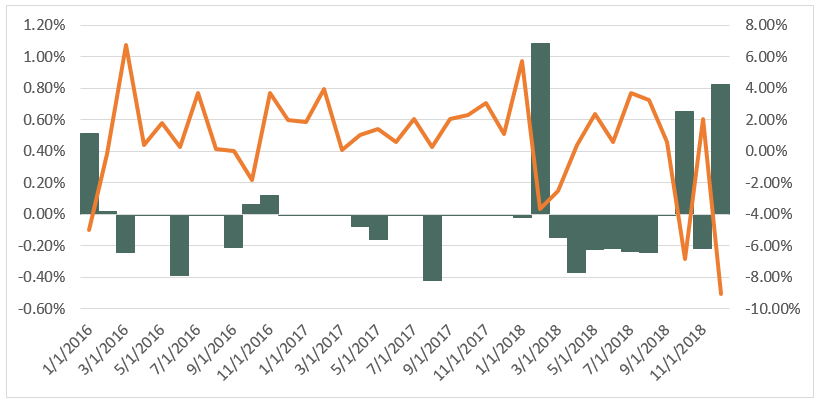
The chart below depicts shows the monthly profits of utilizing this strategy during the same period as the trend following CTA index versus S&P 500.
Simple VIX Hedge vs S&P 500 Monthly Returns 2016-2018 (Orange Line: S&P 500, Blue Bars: VIX Hedge Profit/Loss)

Source: Bloomberg
This example shows how when the hedge has added profit, the S&P 500 declined – notably in early 2016, the first quarter of 2018, and the fourth quarter of 2018. Of course, this strategy will cost us in periods when we get the signal to buy and the S&P 500 bounces strongly higher. However, over the years between 2015 to 2018, this hedge has given us a boost when we sorely needed extra return to offset some of the struggling trend-following.
It’s important to note that if adding a hedge such as this to stand-alone managed futures investment, the cost of this hedge will drag down return so that it is unlikely viable. However, if we have an income producing portfolio along with a managed futures slice, we have room to spend for hedging to increase our chance of protecting in these sudden equity declines.
Disclaimer
The performance data displayed herein is compiled from various sources, primarily Bloomberg. Benchmark index performance shown are the S&P 500 for U.S. equities and Societe General Trend Following CTA Index for managed futures. Assumptions for VIX Index strategy for a 1 mm portfolio is one contract, round-turn slippage of $50 per contract as well as futures bought and sold at official CBOE exchange open. These indices are for the constituents of that index only, and do not represent the entire universe of possible investments within that asset class. And further, that there can be limitations and biases to indices such as survivorship, self-reporting, and instant history. Past performance is not indicative of future results.

