Traders are anxiously awaiting Friday’s USDA’s numbers. Available data was lacking when the government was shut down, and on Friday the Crop Production and the USDA Supply/Demand report will be released.
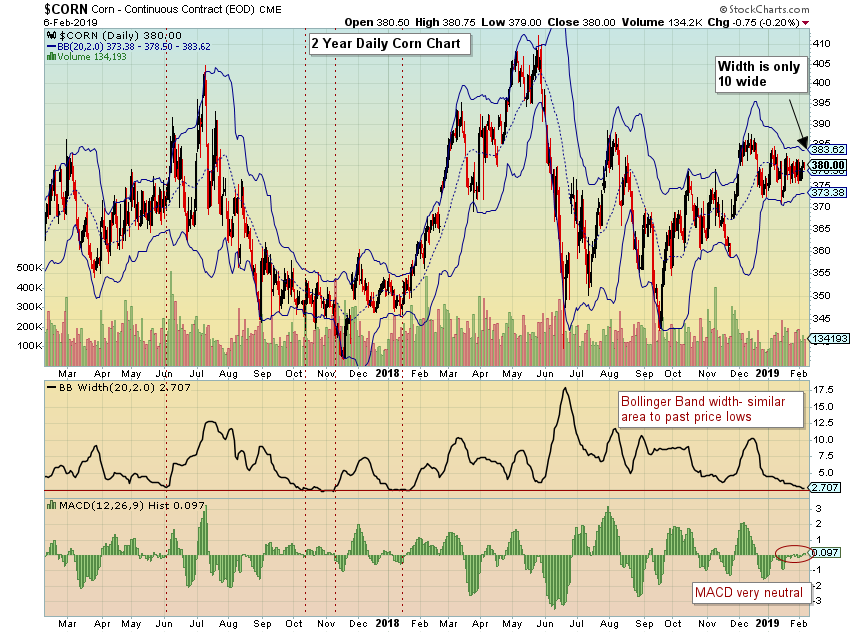
The corn price chart is tightly coiled. In a Bloomberg report last week, they stated “On a 24-month basis, prices are the most compressed in 54 years.” The entire ranges this year for corn futures are only 13 wide on price, and currently 10 wide on Bollinger Bands. As seen in the 2-year chart below, the last few times the BB Width has been at this level or lower, price typically advanced in the near future.

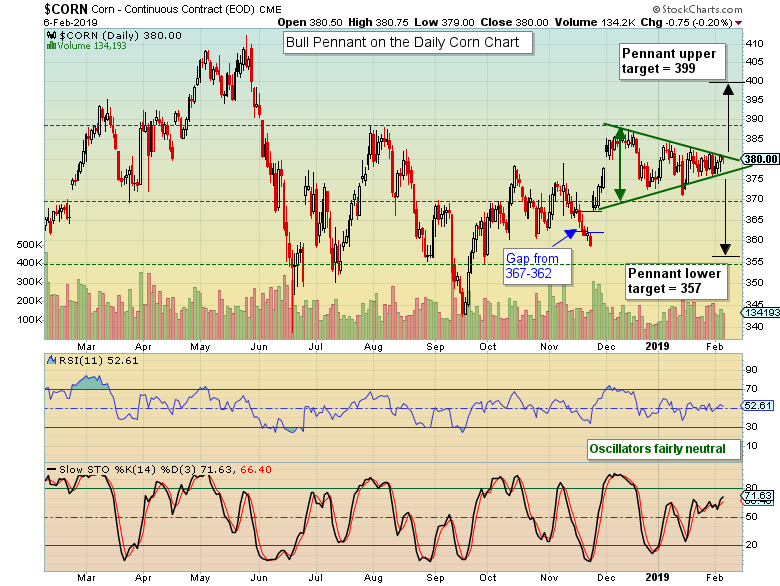
As expected, oscillators have not been very helpful during this price congestion. There is a price pattern that stands out though. The daily chart shows a pennant that is closing in on its apex. One would think a breakout would have occurred by now, however Friday’s data release is the biggest we’ve had all year, so it’s not surprising that prices are still congested.
To obtain a target from a pennant breakout move, take the height of the pennant, then add and/or subtract that from where a breakout could occur. If we take the height of 19, you’d add and subtract that to the pennant lines from today’s date. See chart.
The targets become:
Above: 399 target = 19 + 380
Below: 357 target = 19 – 376

Last, I’ve added previous support and resistance lines to reference (dotted green), and the gap between 367 & 362, which could all be potential turning or “pause” areas. I’ve heard a lot of talk about corn’s big move that is brewing. It’s just a matter of which way it will break out. Best of luck this week if you’re trading corn.
The post Corn’s Price Chart Near Technical Apex Before USDA Report appeared first on Catalyst Hedged Commodity Strategy Fund Blog.

