

Investment bankers have been busy the last several years shepherding in a wave of financing via IPOs, secondaries, debt refinancing, and now SPACs. Given the lower rate environment, companies have gravitated to convertible bonds as a less expensive way than straight equity to raise capital. Many investors are unfamiliar with the convertible bond asset class but are digging in to learn more about the unique characteristics of an instrument that can offer both offense and defense. Moreover, unlike traditional fixed income instruments, convertible bonds tend to be positively correlated to interest rates, and thus particularly relevant as long rates are beginning to back up.
The Pier 88 Investment Team is constructive on the convertible bond asset class given a historically high Sharpe ratio, competitive yield, positive correlation with interest rates, risk-reward profile, and a plethora of new issuances allowing for a diversified portfolio to express thematic views. Within the asset class, we see investment grade convertible securities as a particularly compelling investment opportunity in the current market environment as they provide the potential for equity participation with the added downside protection of better credit profiles. Further, the investment grade convertible securities universe is well diversified across industry sectors, geographic regions and market caps. It also offers a current yield that is superior to the broader equity markets.
As the asset class has a historically high Sharpe ratio, Pier 88 believes a fundamental “equity lens” approach provides a method to uncover compelling investment opportunities in the current macroeconomic environment. By focusing on the underlying equity element of this hybrid security and concentrating on “delta”, a main driver of returns, Pier 88 posits that an investment grade convertible allocation can be a compelling way for investors to achieve more performance from their traditional fixed income portfolios. Essentially, this equity sensitive characteristic enables an active manager to add alpha via security selection. Further, the asset class may be a way to provide some downside protection for those equity investors who seek to be a little more conservative following a multi-year bull market run in equities.
Convertibles as an Asset Class
The convertible asset class is often overlooked and underfollowed. While convertible securities have been issued for over 100 years, investors continue to debate whether it should be an asset allocation from an equity or fixed income viewpoint.
A convertible asset is a hybrid security with debt-and-equity-like features. For example, a traditional convertible bond may have a lower coupon rate than a non-convertible bond issued by the same company. However, it offers the holder the potential upside of conversion into the equity while offering some downside protection through coupon payments and return of principal upon maturity. A holder can convert the bond into a specified number of shares of common stock or cash of equal value.
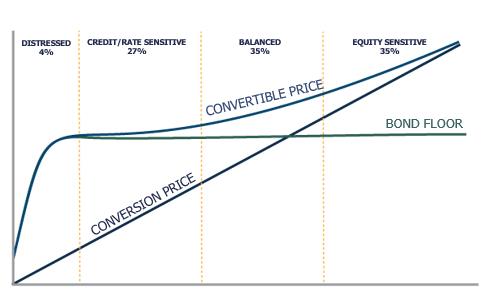
Most convertible bonds reside in the capital structure with traditional fixed income securities. Since 2010, the convertible bond asset class has had a high correlation with the S&P 500, while offering better yield and holding a superior position in the capital structure. Convertible bonds have convexity through an embedded call option offering upside participation in market rallies and the bond floor providing protection in the event of a decline. Below is a classic depiction of the return profile for a convertible bond.
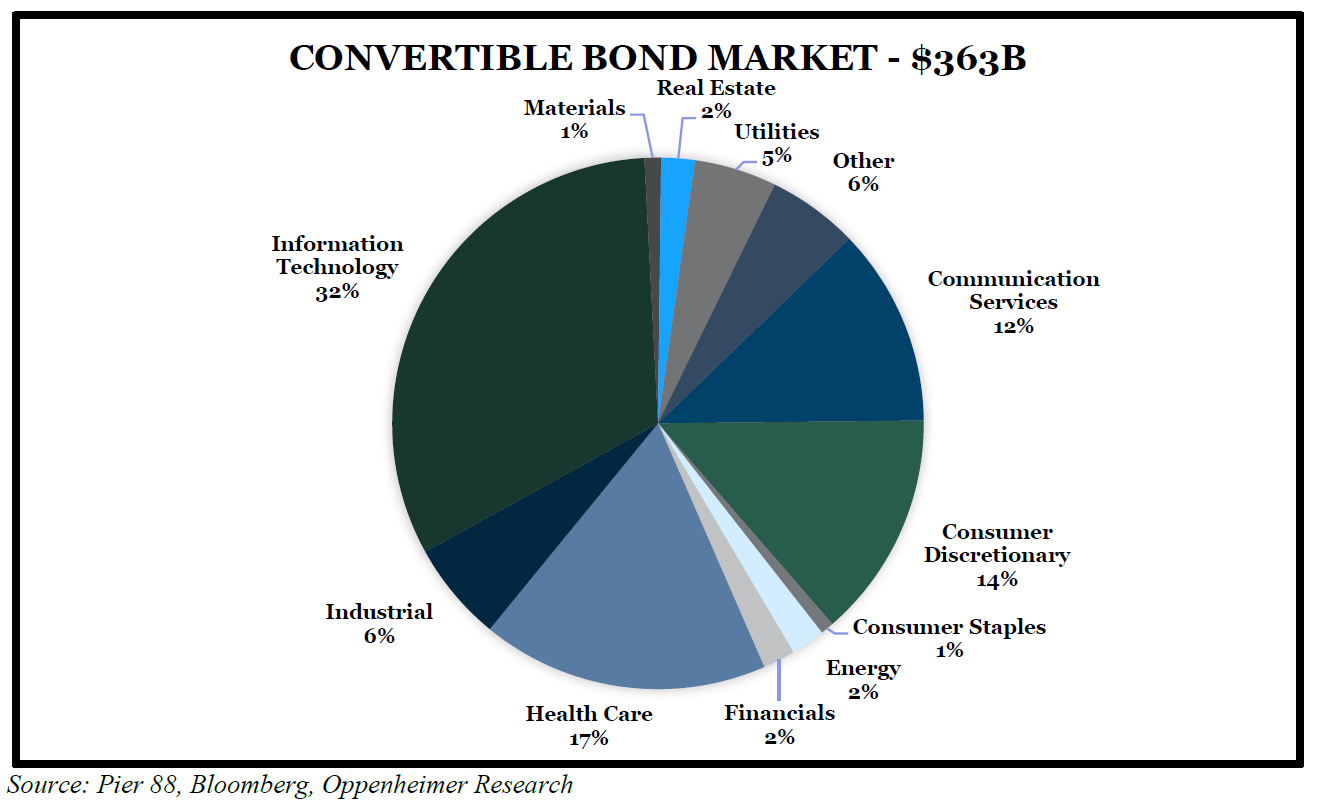
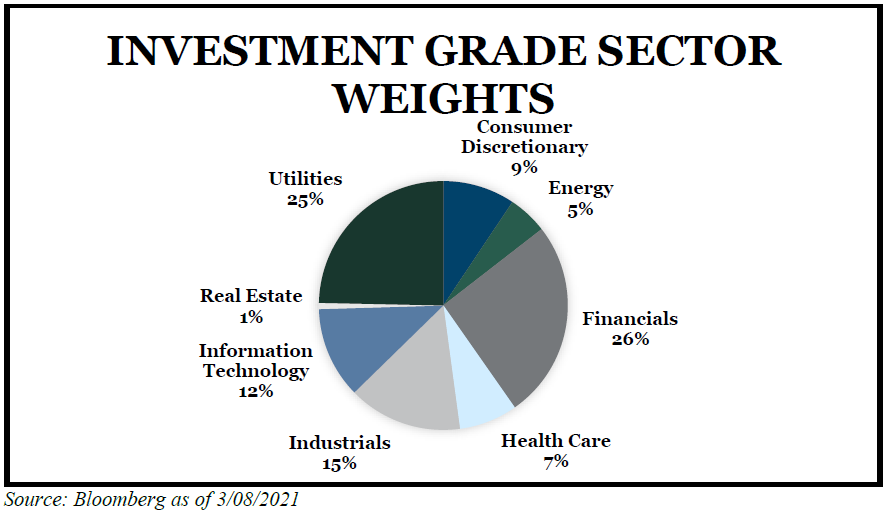
The market has been fairly receptive to companies bringing convertible bonds with the current pace of activity running about 100% over the same time as last year. Year to date there have been close to 50 new deals raising over $26B. The average coupon is 0.47%, premium 49.56% and term of 5.53 years. We anticipate capital market activity to remain active with more deals over the course of the year. The broader convertible bond market is approximately $360B and diversified across a range of sectors and market caps. The following chart depicts a current snapshot of the market.
Superior Sharpe Ratio
We examined data over the last decade to compare the risk/reward attributes of convertible bonds relative to equity markets. To get a broader sample size we examined the performance of investment grade and non-investment grade convertibles relative to equities as represented by the S&P and Russell 2000 Index. The data was quite illuminating: over this decade convertibles offered a better quarterly return, better yield, lower standard deviation and better Sharpe ratio. The table below displays these findings.1
Dec 2010 – Dec 2020 |
Average Quarterly Return |
Standard Deviation |
Yield |
Sharpe Ratio |
| ICE BofA US Convertibles Index (VXA0) | 3.35% | 13.86% | 1.92% | 0.86 |
| S&P 500 Index (SPX) | 3.23% | 14.73% | 1.48% | 0.77 |
| Russell 2000 Index (RTY) | 3.28% | 22.04% | 0.98% | 0.53 |
Source: Pier 88/Bloomberg
The data is compelling – better yield, higher return, less volatility. Within the convertible bond asset class, our team prefers a focus on the investment grade portion of the market as the instruments tend to offer better yields than the broader convertible market and an incremental layer of protection given higher credit quality. This defensiveness proved to be attractive during the sell-off in 2018. Investment grade convertibles were a rare instrument that managed to eke out positive returns when other risk assets sold off sharply as depicted below.
Period |
VX5C |
HY Bonds |
NASDAQ |
S&P |
Russell 2000 S&P |
Midcap 400 |
Russell Microcap |
| 2018 | 2.10% | -2.08% | -2.81% | -4.38% | -11.03% | -11.10% | -13.00% |
Source: Pier 88/Bloomberg
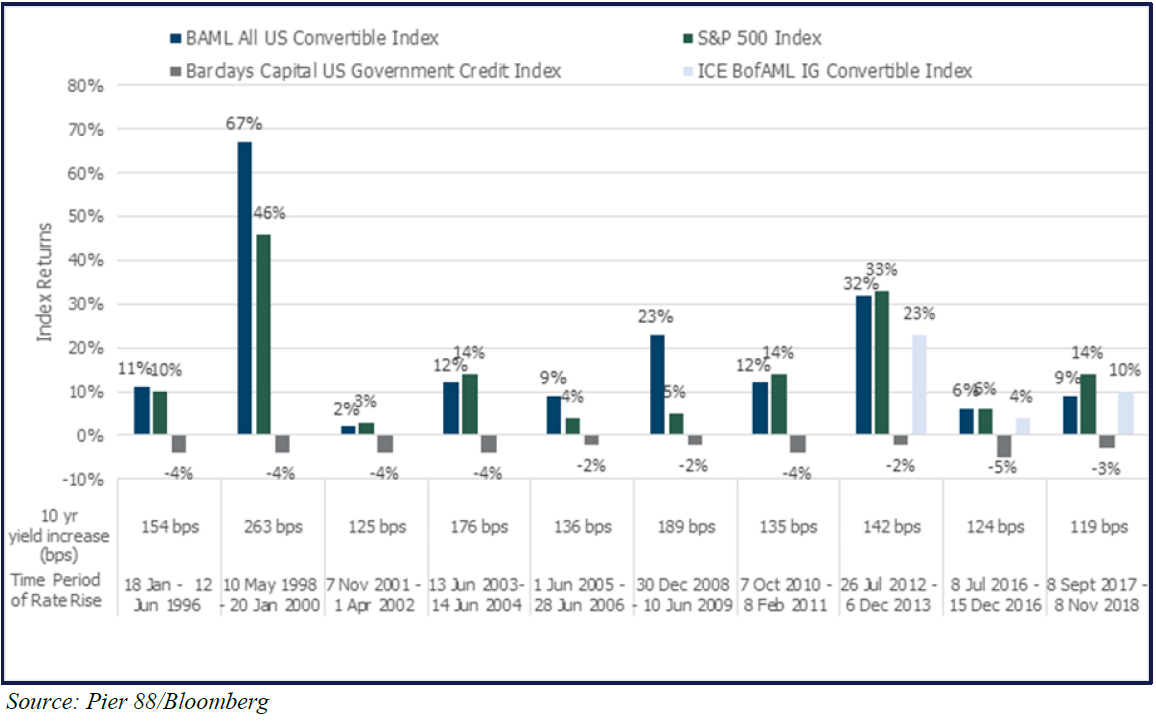
In contrast to Treasuries, convertibles have performed well in rising interest rate environments. The asset class did not experience negative returns during the past ten historical rate hikes.
Equity-Like Returns in Rising-Rate Environment2
As mentioned, convertible assets are a hybrid with both equity and fixed income characteristics and have often been overlooked in favor of high yield or equity allocations. Given its unique complexity, convertibles often trade at a discount to their fixed income counterparts. Currently, investment grade convertible bonds offer equity exposure with an average delta of 61% and an average yield of 3.56%.3 Delta measures the change in the convertible assets’ price with respect to the change in the underlying common stock price. Delta usually increases as the underlying stock price increases and will move to 1.0 (or 100%) as the convertible becomes deep in the money. If a convertible asset trades at a 1.0 delta, the change in the convertible bond price becomes highly correlated to the change in the underlying stock price. Conversely, as the convertible assets move out of the money the delta will decline towards zero.
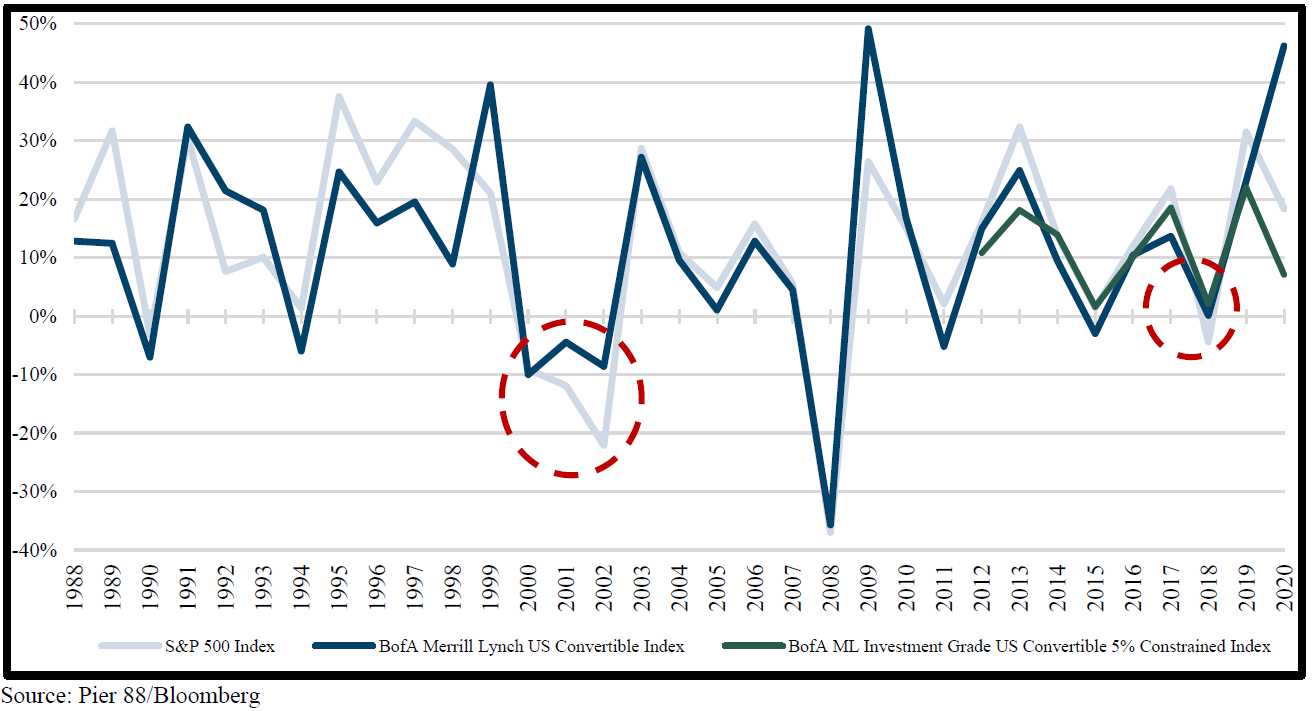
Maintaining an investment grade profile can minimize default risk. Examining historical default data, our research suggests high credit quality companies with a balanced convertible profile offer a better risk/reward relative to other asset classes. The following graph compares the performance of equities to convertible assets during periods of market volatility. The data illustrates how the convertible asset class outperformed equities during technology-driven market sell-off in 2002. Furthermore, the investment grade convertible index offered better downside protection during the January 2016 sell-off, while the investment grade convertibles significantly outperformed during the broader market declines in 2018. Pier 88 posits that a portfolio consisting of investment grade convertible securities should behave similarly in the event of a market downturn.
Convertible Assets versus Equities (1988 – 2020)4
On the investment grade side, issuers are well distributed across large, mid and small cap with a market cap range from $745M to $300B. The investment grade convertible bond universe is well diversified across industry sectors, geographic regions and market caps. Well-known issuers include companies such as Anthem, Micron Technology, Booking Holdings, Wells Fargo, Bank America, and Stanley Black & Decker. Issuers in the investment grade convertibles market tend to have strong credit.
The “Equity Lens” Approach
As convertible bonds are hybrid securities blending equities and debt, there are multiple approaches to managing convertible bonds. Some may focus on the credit aspects of the market, while others focus on the structure of a particular security. In this market our view is that the delta, or “equity sensitivity” of the security, is the primary driver of returns. As the charts below show, delta has driven most of the performance of convertible bonds, particularly in investment grade convertible bonds.
While credit research and understanding the structure of a convertible security is important, Pier 88 believes getting the investment call right on the underlying equity of an issuer is critical. Indeed, a review of the bond index confirms the importance of getting the stock call right. The following table shows that during 2020, the top 10 performing securities in the ICE BofA Investment Grade Convertible Bond Index had 300% equity performance capture, while the bottom 10 performing securities only experienced 14% of the equity decline, elucidating the asymmetric risk reward in the investment grade convertibles asset class.5
Top 10 ICE BofA Investment Grade Convertible Bond Index Performer6
Bond / Preferred |
Stock |
Bond Performance |
Stock Performance |
| MU 3 ⅛ 05/01/32 | MU | 42% | 40% |
| NEE 4.872 09/01/22 | NEE | 18% | 27% |
| BAC 7 ¼ PERP | BAC | 10% | -14% |
| WFC 7 ½ PERP | WFC | 10% | -44% |
| AMG 5.15 10/15/37 | AMG | 9% | 20% |
| SWK 5 ¼ 11/15/22 | SWK | 7% | 8% |
| ANTM 2 ¾ 10/15/42 | ANTM | 7% | 6% |
| TSLX 4 ½ 08/01/22 | TSLX | 6% | -3% |
| PSEC 4.95 07/15/22 | PSEC | 6% | -16% |
| ILMN 0 ½ 06/15/2 | ILMN | 5% | 12% |
| Mean | 12% | 4% | |
| Median | 8% | 7% | |
| Capture | 300% | ||
Bottom 10 ICE BofA Investment Grade Convertible Bond Index Performers7
Bond / Preferred (VX5C Index) |
Stock |
Bond Performance |
Stock Performance |
| NHI 3 ¼ 04/01/21 | NHI | -8% | -15% |
| GSK 0 06/22/23 | GSK | -5% | -22% |
| EEFT 0 ¾ 03/15/49 | EEFT | -5% | –8% |
| AEP 6 ⅛ 03/15/22 | AEP | -2% | -12% |
| D 7 ¼ 06/01/22 | D | -1% | 9% |
| DTE 6 ¼ 11/01/22 | DTE | 0% | -7% |
| BKNG 0.9 09/15/21 | BKNG | 2% | 8% |
| ILMN 0 08/15/23 | ILMN | 2% | 12% |
| SRC 3 ¾ 05/15/21 | SRC | 2% | -18% |
| NHI 3 ¼ 04/01/21 | NHI | 3% | -13% |
| Mean | -1% | -7% | |
| Median | -1% | -10% | |
| Capture | 14% | ||
As the above charts illustrate, there is a pronounced relationship between the convertible security and underlying equity performance. The data suggests that the equity sensitivity has driven the upside performance while the fixed income characteristics enabled superior performance on the downside.
The case for an allocation to convertible bonds continues to be strong and the case for active management in this space even stronger. Employing a fundamental “equity lens” approach can uncover compelling investments in the current macroeconomic environment. Convertibles securities can likely offer diversification to lower overall portfolio volatility. An investment grade convertible bond allocation may be a differentiated way for investors to achieve performance from the traditional fixed income and high dividend equity investment. Convertible bonds have traditionally outperformed in rising interest rate environments. Additionally, convertible coupons provide a more dependable income stream compared to equity dividends. The bond “floor” or par value can also provide some downside protection for those equity investors who seek to be a little more conservative following a multi-year bull market run in equities.
The Pier 88 Investment Team is constructive on the convertible bond asset class given a historically high Sharpe ratio, competitive yield, positive correlation with interest rates, risk-reward profile, and a plethora of new issuances allowing for a diversified portfolio. Within the asset class, we see investment grade convertible securities as a particularly compelling investment opportunity in the current market environment as they provide the potential for equity participation with the added downside protection of better credit profiles.
Disclosures
This presentation is not an offer to sell securities of any investment fund or a solicitation of offers to buy any such securities. Securities of Pier 88 (the “Fund”) are offered to selected investors only by means of a complete offering memorandum and related subscription materials which contain significant additional information about the terms of an investment in the Fund (such documents, the “Offering Documents”). An investment in any strategy, including the strategy described herein, involves a high degree of risk. There is no guarantee that the investment objective will be achieved. Past performance of these strategies is not necessarily indicative of future results. There is the possibility of loss and all investment involves risk including the loss of principal. Securities of the Fund are not registered with any regulatory authority, are offered pursuant to exemptions from such registration, and are subject to significant restrictions.
The graphs, charts and other visual aids are provided for informational purposes only. None of these graphs, charts or visual aids can of themselves be used to make investment decisions. No representation is made that these will assist any person in making investment decisions and no graph, chart or other visual aid can capture all factors and variables required in making such decisions.
Performance results of convertible bonds is presented for information purposes only and reflect the impact that material economic and market factors had on the manager’s decision-making process. No representation is being made that any investor or portfolio will or is likely to achieve profits or losses similar to those shown. References to market or composite indices, benchmarks, or other measures of relative market performance over a specified period of time are provided for information only. Reference or comparison to an index does not imply that the portfolio will be constructed in the same way as the index or achieve returns, volatility, or other results similar to the index. Indices are unmanaged, include the reinvestment of dividends and do not reflect transaction costs or any performance fees. Unlike indices, the Fund will be actively managed and may include substantially fewer and different securities than those comprising each index.
Russell 2000 Index (RTY): The Russell 2000 Index measures the performance of the small-cap segment of the U.S. equity universe. The Russell 2000 Index is a subset of the Russell 3000® Index representing approximately 8% of the total market capitalization of that index. It includes approximately 2,000 of the smallest securities based on a combination of their market cap and current index membership.
S&P 500 Index (SPX): The S&P 500 focuses on the large-cap sector of the market; however, since it includes a significant portion of the total value of the market, it also represents the market. Companies in the S&P 500 are considered leading companies in leading industries.
BofA Merrill Lynch Bond Indices (VXA0 / VX5C): Source BofA Merrill Lynch, used with permission. Source BofA Merrill Lynch, used with permission. BOFA Merrill Lynch is licensing the BOFA Merrill Lynch indices “As Is,” makes no warranties regarding same, does not guarantee the suitability, quality, accuracy, timeliness, and/or completeness of the BOFA Merrill Lynch indices or any data included in, related to, or derived therefrom, assumes no liability in connection with their use, and does not sponsor, endorse or recommend Pier 88 Investment Partners LLC, or any of its products or services. The BofA Merrill Lynch All U.S. Convertibles Index (VXA0) measures the return of all U.S. convertibles. The BofA Merrill Lynch Investment Grade US Convertible 5% Constrained Index (VX5C) Index is a market capitalization-weighted index of domestic corporate convertible securities.
Bloomberg Barclays US Government/Credit Bond Index: The Bloomberg Barclays US Government/Credit Bond Index is a broad-based flagship benchmark that measures the non-securitized component of the US Aggregate Index. It includes investment grade, US dollar-denominated, fixed-rate Treasuries, government related and corporate securities.
DM #405
1Pier 88 / Bloomberg. Index returns do not include dividends. Trailing 12 month yield as of 3/10/2021.
2Pier 88 / Bloomberg (Index Symbols: VXA0, SPX, LUGCTRUU)
3Pier 88 / Bloomberg
4Pier 88 / Bloomberg (Index Symbols: SPX, VXA0, VX5C)
5Pier 88 / Bloomberg
6Pier 88 / Bloomberg, VX5C Index. Excludes securities that matured in 2020 and only includes securities held for the entire year.
7Pier 88 / Bloomberg, VX5C Index. Excludes securities that matured in 2020 and only includes securities held for the entire year.