Key Points
- Bear markets in consumer & tech stocks happen sometimes.
- From peak 2007 into the Global Financial Crisis to the trough in 2009, consumer stocks underperformed.
- Consumers go down but they don’t tend to stay down.
Bear Markets Are A Normal Part Of The Business Cycle.
There are always some hindsight-based methods of predicting bear markets and taking full risk-off positioning. Sometimes they work perfectly. While other times they create a ton of capital gains and tax liabilities only to realize the exit level should have been where the cost averaging strategy began. Right now, I have rarely seen market sentiment this bad. It can improve vastly more than it can deteriorate. Let’s assume we are all investing for a long-term period of time, and we are willing to hold a high-quality basket of great companies that we recognize and spend our money on each year. Let’s call them “top brands.” We know from last week’s blog that historically; the market goes up 80% of the time and the average annual drawdown from peak to trough is about 15%. We have that and then some this year already. We now know that the policies surrounding COVID-19 were impactful, and these policy decisions have caused ripple effects across supply chains, labor availability and consumer spending trends. High inflation, higher interest rates and constrictive monetary policy has caused the current dislocation in stocks. These are outlier events when looking back over 100 years. Every bear market is unique and is caused by certain things, but we know even the best companies tend to get clobbered in big drawdowns. What we also know is, these great companies take market share during downturns because they have the balance sheet, innovation, and visionary management teams to think long-term and invest for the next recovery phase. No one knows how long this unique bear market will last, but I have extreme confidence that the outcome will be the same as other drawdowns: the leading brands will emerge stronger from the bear market and the stocks will recover gains over time and better than most average companies. I have over 30+ years of data showing this outcome, so there is nothing that makes me think this time will be different. Just remember, the best long-term outcomes happen when you are willing to add to great businesses when the market puts the stocks on sale, cost averaging helps speed up the recovery time. It’s just math.
Here’s a link to last week’s post on the benefits of cost averaging. I use real world examples with Starbucks and Chipotle.
https://catalyst-insights.com/analysis-cost-averaging-adds-significant-value/
Important Reminder: Focus On The long-term.
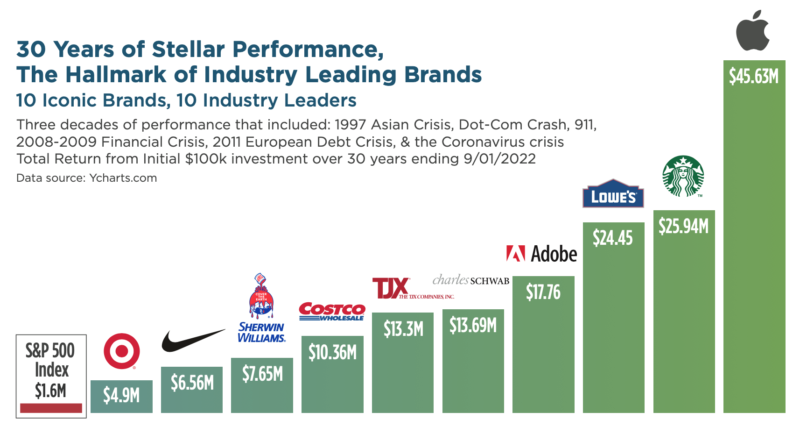
Below, I have re-posted the 30-year look-back of the performance of some of the most important consumption brand leaders across key spending industries. Over the last 30 years, we’ve had to endure multiple recessions, bear markets, flash crashes, 911, multiple Fed-induced taper tantrums, the European debt crisis, the 2020 Coronavirus, and today’s current high inflationary environment. Through all this turmoil, great brands grew, took market share, and recovered faster than most other companies. I suspect this will be true after we move past today’s environment.

Data source: Ycharts.com
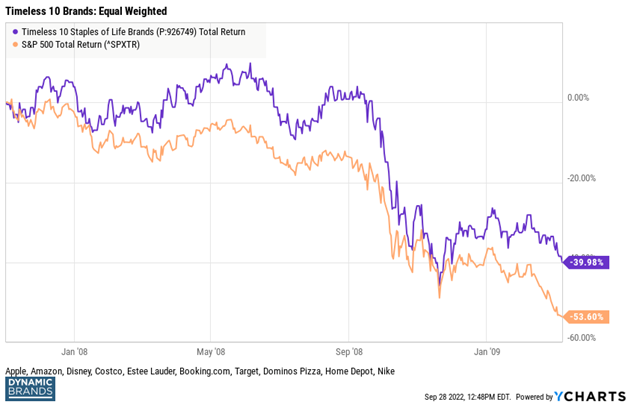
Market Peak 2007 To Market Trough 2009.
For today’s exercise, I have built an equal-weighted Consumer brands model using key brand leaders in the important spending categories of: tech hardware (Apple), e-commerce (Amazon), fast casual & delivery restaurants (Domino’s Pizza), warehouse shopping (Costco), leisure & streaming (Disney), cosmetics (Estee Lauder), home improvements (Home Depot), athleisure apparel (Nike), general merchandise retail (Target), and travel platforms (Booking.com). This timeless 10 iconic brands model is a proxy for the Consumer Discretionary sector. Brand relevancy changes over time so it’s vital to understand which brands are still the dominant innovators but this is a worthy basket for the 2007 period. If you bought this equal-weighted 10 stock portfolio at the peak of the market on November 1, 2007 and held this core portfolio through the financial crisis until the March 9, 2009 bottom, here are the results. It was not fun, and the returns were deeply negative like today.

Source: Ycharts.com
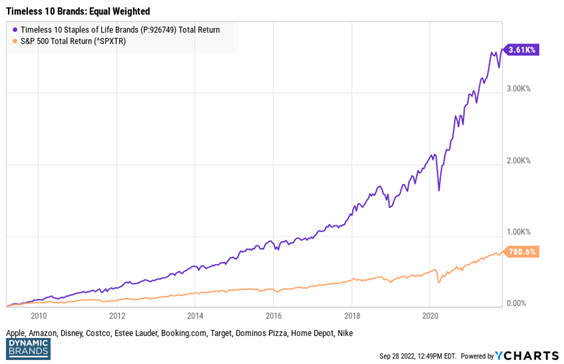
Market Trough 2009 To Market Peak November 2021.
Consumer stocks and technology stocks generally peaked in November 2021 last year. Since that time, rates have gone straight up, inflation is at 40-year highs and the Fed has become very restrictive. So, stocks have largely been a tough place to be. These periods happen sometimes.
Here’s how the Timeless 10 iconic brands portfolio performed from the market’s trough on March 9, 2009 until the recent peak in November of last year. The numbers are not important to me, the logic is all that matters. The U.S. and global economy is driven by domestic consumer spending. So, more often than not, the most dominant brands serving global consumers should be strong performers over time. Not every year, not every day, but over wider periods of time, common sense should tell you what the outcome should be. I urge you to use this illustration to consider using these infrequent periods of underperformance to build bigger positions into whatever trough we get over the next 6 months. Here’s the results into last year’s peak. Not too shabby:

Source: Ycharts.com
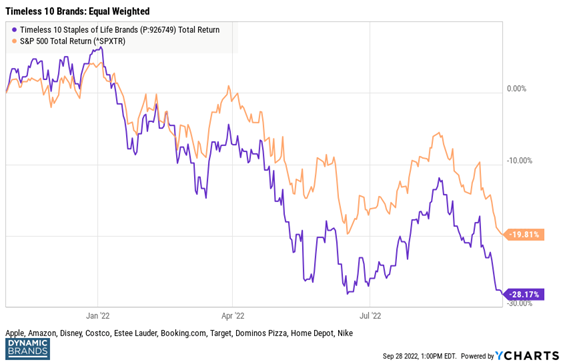
Timeless 10 Iconic Brands From Market Peak In 2021 To Today.
Today’s underperformance feels a lot like the late 2007 to early 2009 performance while also being different. In 2007, consumer balance sheets were impaired, they were flipping houses, and had incredible credit card debt. A massive deleveraging needed to happen. Today, it’s a bit different, although changing on the margin due to inflation. Since 2009, consumers have built up strong savings and have radically de-levered. Today’s high inflation though, is putting a strain on the average household and credit card debt and delinquencies have been rising lately. Most consumer stocks reflect this inflation-induced strain. Many of the most admired and profitable brands have already seen 20-50% pullbacks from the November peak. The market has been discounting the slowdown for many months. Today, when consumers feel the pinch, they change their spending habits. They spend less, consolidate their brand loyalty and trade down where they can. This will have an effect on which brands outperform and underperform and the market is well on its way to discounting this outcome. Our current portfolio reflects our view of which brands will win in today’s difficult environment.
Here’s how the Timeless 10 brands have performed since last November’s peak. A struggle for now but I think you know how this movie ends.

Source: Ycharts.com
SUMMARY:
Over long periods of time, consumer and tech stocks have outperformed the market handily. Over shorter periods of time, they can lag for a variety of reasons. Given we are a consumer economy and tech is at the center of everything we do, I’m confident these two sectors will resume their streak of outperformance once the macro stops driving markets, inflation slowly rolls over and the Fed stops over-reacting to lagging indicators. Money will rotate back into leaders at some point and today, there’s over $5 trillion sitting in money market accounts and another $3+ trillion in bank accounts. At some point, there’s an epic wall of money that will feel safe to return to equities and the best companies will get their fair share of flows. Hold the core basket and add on these deep dips to compress the recovery time.
Disclosure:
This information was produced by Accuvest and the opinions expressed are those of the author as of the date of writing and are subject to change. Any research is based on the author’s proprietary research and analysis of global markets and investing. The information and/or analysis presented have been compiled or arrived at from sources believed to be reliable, however the author does not make any representation as their accuracy or completeness and does not accept liability for any loss arising from the use hereof. Some internally generated information may be considered theoretical in nature and is subject to inherent limitations associated therein. There are no material changes to the conditions, objectives or investment strategies of the model portfolios for the period portrayed. Any sectors or allocations referenced may or may not be represented in portfolios managed by the author, and do not represent all of the securities purchased, sold or recommended for client accounts. The reader should not assume that any investments in sectors and markets identified or described were or will be profitable. Investing entails risks, including possible loss of principal. The use of tools cannot guarantee performance. The charts depicted within this presentation are for illustrative purposes only and are not indicative of future performance. Past performance is no guarantee of future results.
The Chipotle hypothetical cost averaging example highlights the potential power of holding core positions in industry leading brands and being committed to adding to these positions when the market acts irrationally. Cost averaging leading companies can add significant value to your long-term portfolio even if you do not catch the absolute bottom in the stock. Details on this hypothetical are below.

