I find the most interesting gold chart right now being the Gold Volatility Index. Volatility has been well below average for nearly 2 years. Single digit readings were seen in…
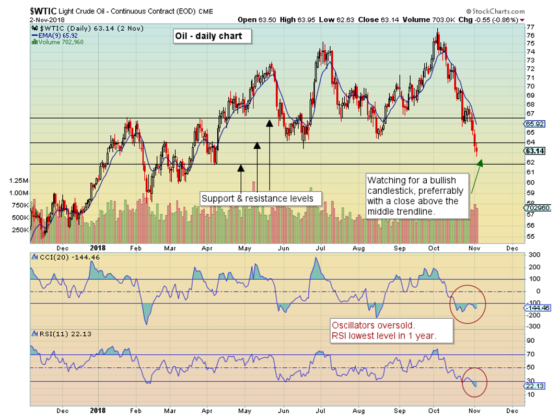
October was a brutal month for oil. Crude dropped by nearly 20% in October and the decline continued into November. The technical indicators on the daily chart are in oversold…
The markets have seen sharp declines in equities and oil this month. Not all areas have been difficult though. Gold has seen healthy gains (5% advancement, 2nd chart) and the…
After 6 months of declining, we’re starting to see some positive commentary on the gold front. The past few days there has been gold bullish news, not just pertaining to…
It’s hard to ignore all of the talk and articles about oil having a $100 target. That’s a significantly higher amount from where it trades now at roughly $72. The…
Gold is not out of the woods yet with the current downtrend in its fifth month, however, I’m seeing some signs of life in the metal. This past week there…
Crude has had quite the run lately. Through yesterday, it accomplished an 8.2% rise in 9 trading days. Technically, it now sits at its upper Bollinger Band and is at…
Oil has taken investors on quite the ride lately, especially if those investors were long. The asset has become increasingly volatile, often moving double digits in a matter of days.…
We’ve been looking over the data from last month’s corn action. We weren’t very pleased with the tariff announcements coming 2 weeks ahead of the USDA report and wanted to…