Bullish Factors in Oil That the Charts Aren’t Reflecting

The oil charts look overbought, but seasonal factors and other factors show a bullish case for oil. The arctic blast of cold air that has started in the northern U.S. could affect demand and production.

The crude oil chart below demonstrates the recent range trading, support and resistance levels, and technical indicators which were recently overbought. Just yesterday, the 50-day moving average was used as a support level near $51. The recent price consolidation is a relief after months of wild price movements.

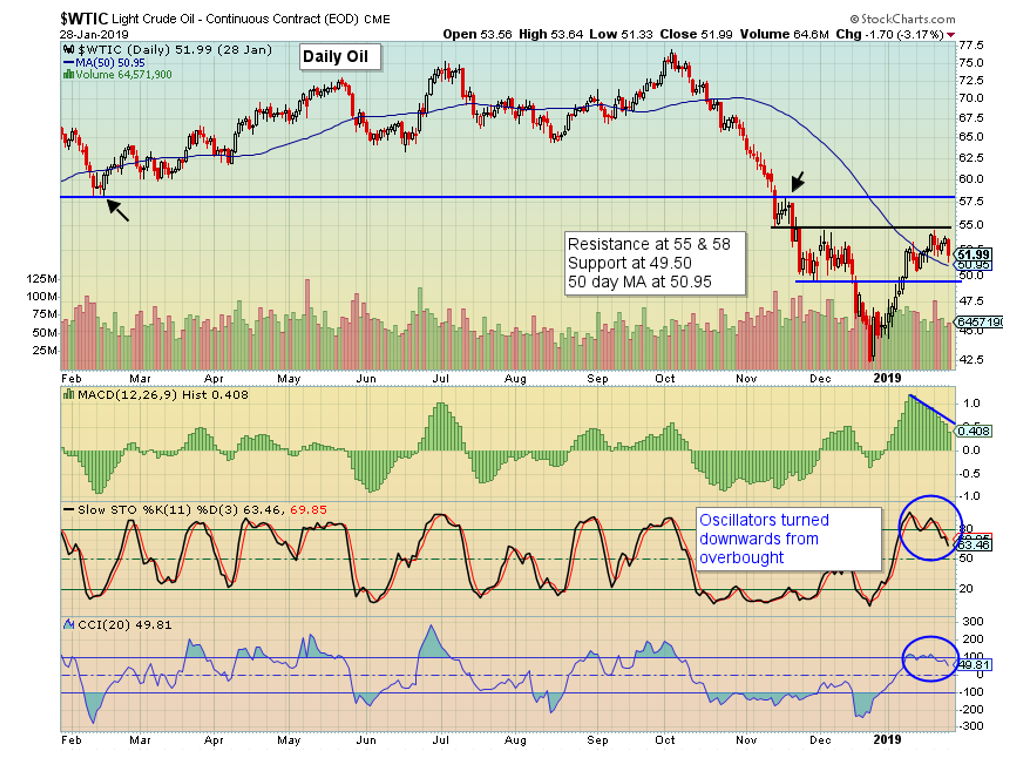
If isolating the charts with its price and technical factors, with the oscillators turning downward and above resistance recently being tested, one could think that a price decline is in order.  Some systems and traders only look at technical analysis.  This could prove dangerous in the current environment for the following reasons, even outside of the political chaos in Venezuela:

  • Arctic weather in the U.S
  • February has historically been a seasonally bullish month for price

As we sit in Wisconsin with -22 wind chill weather outside, we may be a little biased on this first item. Extremely cold weather can affect the amount of heating oil in homes being used, and can affect oil production and transportation within the United States. Investopedia has a clear explanation of how cold temperatures can affect production:

“Wintry Conditions Affect Oil Production: Cold weather can also affect oil production negatively if wintry conditions cause disruptions in oil production activities. If the temperatures drop low enough, operations cannot produce at full capacity. Poor traffic conditions caused by snow can also disrupt the transportation of oil products to storage facilities and to consumers. Crude oil has a freezing point of between -40- and -60-degrees Fahrenheit. If temperatures drop to these depths, as they did in North Dakota in 2013, the supply side of oil and gas prices will be affected.”

As of this writing, the wind chill is -41F with outside temperature -13F in Bismarck, North Dakota. Looking ahead, they should see a low of -26 within the next day. This shouldn’t be enough to freeze oil, but it could have an effect on transportation and operations.

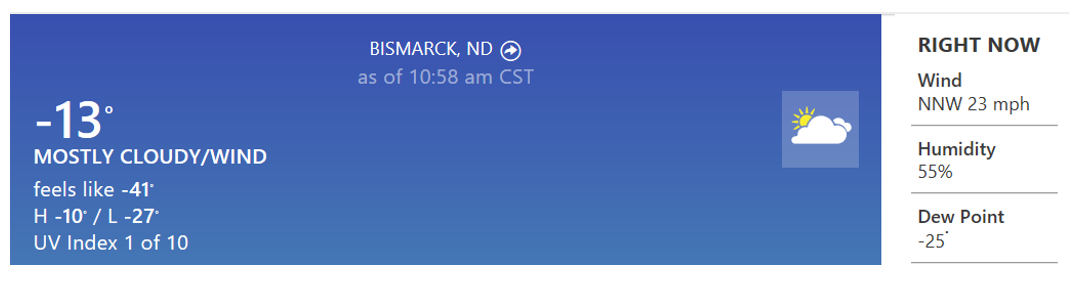
Chart from Weather.com

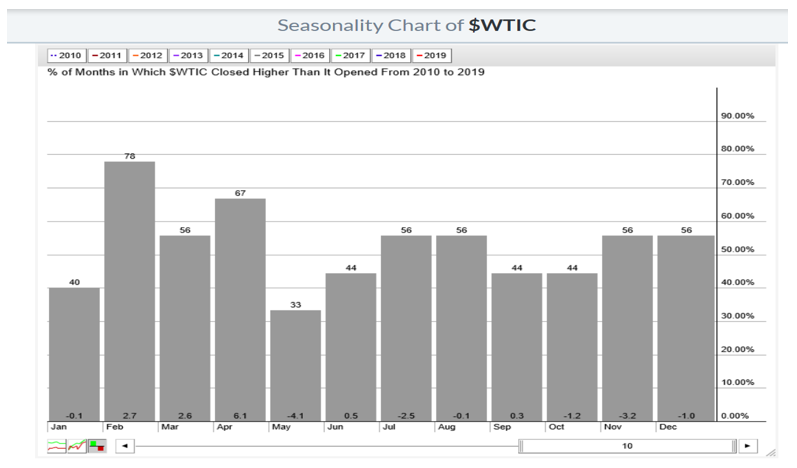
Next, February has a seasonal factor to it. Looking at the 10-year Stockcharts.com monthly chart, crude oil ($WTIC) shows February as the month with the highest percentage of time closing above it’s opening price. Seventy-eight percent of the time over the past 10 years, crude closed higher than where it opened in February. The average gain was 2.7%. One can extract from the chart that February is the first of a few bullish months, overall making Q1 a potentially strong quarter for price.

Numbers will be released today and tomorrow reflecting last week’s oil reserves draw or build.  Next week’s report should reflect the winter environment we are seeing this week.

In conclusion, there are a few bullish factors for oil now between the weather, seasonality and price bouncing off the 50-day moving average yesterday that may not be fully reflected in the current price.

The post Bullish Factors in Oil That the Charts Aren’t Reflecting appeared first on Catalyst Hedged Commodity Strategy Fund Blog.

Latest

A Summer Surge: August 2024 HANDLS Monthly Report

After a challenging July that saw investors sell off high-flying technology stocks, buyers returned to the market in August, bidding up risk assets across the board.

Where are the Hidden Risks in Your Portfolio Currently? Plus, an idea.

Allocators add new exposures for a variety of reasons; diversification, returns, risk mitigation, etc. Understanding this, what is the most over-owned and expensive sector today?

Consumer Spending: Are Consumers Tapped Out or Pushing Back?

Consumer Spending: Are Consumers Tapped Out or Pushing Back?  Key...

Knocked Down Inflation: July 2024 HANDLS Monthly Report

After a red-hot June built on expectations that the Federal Reserve may succeed at killing inflation without killing the economy, July saw investors begin to question the soft-landing narrative.

Newsletter

Don't miss

A Summer Surge: August 2024 HANDLS Monthly Report

After a challenging July that saw investors sell off high-flying technology stocks, buyers returned to the market in August, bidding up risk assets across the board.

Where are the Hidden Risks in Your Portfolio Currently? Plus, an idea.

Allocators add new exposures for a variety of reasons; diversification, returns, risk mitigation, etc. Understanding this, what is the most over-owned and expensive sector today?

Consumer Spending: Are Consumers Tapped Out or Pushing Back?

Consumer Spending: Are Consumers Tapped Out or Pushing Back?  Key...

Knocked Down Inflation: July 2024 HANDLS Monthly Report

After a red-hot June built on expectations that the Federal Reserve may succeed at killing inflation without killing the economy, July saw investors begin to question the soft-landing narrative.

Carry Traders Get Carried Out

It looks like a big margin call started in Japan. The Japanese Yen has become a funding currency in recent years, a source of cheap financing with the proceeds reinvested in better returning assets – such as US$ listed AI stocks.
Kimberly Rios, CFA, CMT, Portfolio Manager
Kimberly Rios joined Catalyst Capital Advisors as a Portfolio Manager in 2014. She is currently a Portfolio Manager of an options-based commodity fund at Catalyst Funds. She carries the Series 3 license, the Chartered Financial Analyst (CFA) Designation, the Chartered Market Technician (CMT) designation, and is a member of the National Futures Association. Ms. Rios has degrees in Economics and Finance from the University of Arizona.

A Summer Surge: August 2024 HANDLS Monthly Report

After a challenging July that saw investors sell off high-flying technology stocks, buyers returned to the market in August, bidding up risk assets across the board.

Where are the Hidden Risks in Your Portfolio Currently? Plus, an idea.

Allocators add new exposures for a variety of reasons; diversification, returns, risk mitigation, etc. Understanding this, what is the most over-owned and expensive sector today?

Consumer Spending: Are Consumers Tapped Out or Pushing Back?

Consumer Spending: Are Consumers Tapped Out or Pushing Back?  Key Summary: Sentiment towards the consumer and spending is about as negative as I’ve seen. Assets...