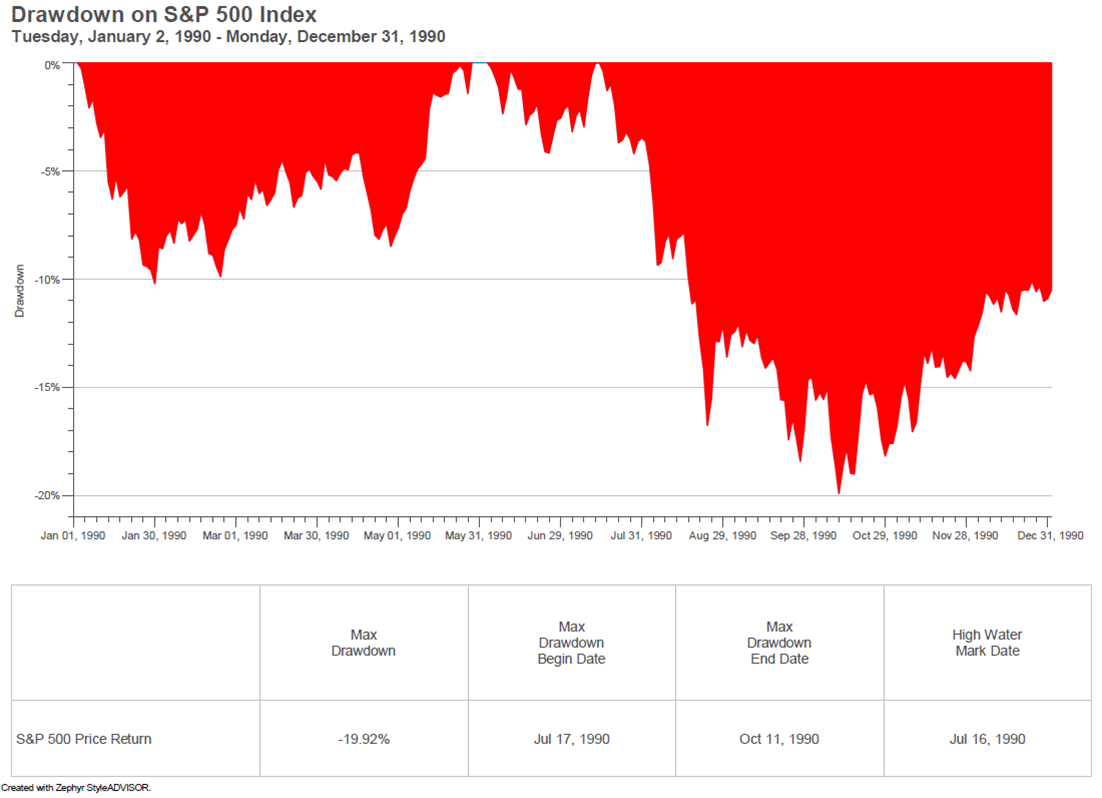
You’re hearing it every day – the bull market will become the longest in history this week, officially on Wednesday, August 22, 2018. The basis for comparison is a 1990s bull market that began October 11, 1990.
Is this declaration accurate?
If we apply the definition of a bear market – that is, a cumulative decline exceeding 20% from the prior high – then technically, the longest bull market in history began on December 4, 1987, because the October 1990 decline fell a scant 0.08% shy of official bear market territory. For the by-the-book perfectionists, we still have roughly 1,000 days left to go before we set a new record.

For those who are more liberal with technicalities, the 1990 starting point will suffice. Let’s look closer. Using the S&P 500 as our proxy, the market was down 19.92% at the close of trading on 10/11/1990. By this standard, however, why not measure today’s bull market beginning from the 19.39% drawdown on October 3, 2011? Isn’t a bit contradicting to loosen the rules with a rounding measurement that is as exact as the nearest tenth of a percent?
Others argue, with valid reasoning, that a bull should be measured from a previous high water mark, which would mean the current bull market began March 28, 2013 when the S&P 500 broke above its pre-2008 high of 1,565.15 set October 9, 2007 (what is it about October?). By this measure, the bull has only recently reached secular status (five years old), making it relatively youthful by historical standards. Taking this logic one step further, we could measure from the date at which an investor in the S&P 500 returned to break-even after accounting for dividends, which would have been August 16, 2012 (a 125% gain). After all, does it matter to the investor that he made 125% from 3/9/2009 to 8/16/2012 when in effect, he was only back to breakeven?
Yet, why are we talking only about the S&P 500 to determine market cycles? The Russell 2000 has suffered three bear markets since 2009, by definition. Multiple other subsets of the U.S. stock market have hit bear market territory in recent years, from market cap subsets to whole sectors. While the S&P 500 is widely used as our broad market barometer, is it fair to officially peg a market type using only the biggest of the bunch?
Devil’s advocate here – yes, it is fair, because that IS how most have measured historical bear markets, after all…let’s not be so hypocritical!
Finally, at the time of this writing, the S&P 500 still has not matched its January 26, 2018 high of 2872.87. As we write this, it is less than 50 basis points away. Maybe it has succeeded by the time you read this, or maybe not. In the latter case, if the index declines 20% from here, then the bull market by definition will have ended seven months ago, and all this chatter is moot.
There are many ways to skin a cat.
We ourselves have jumped on the bandwagon and cited August 2018 as when the bull market becomes the longest in history. Sometimes simplicity is an efficient means of conveying a point. We are all guilty.
But this dizzying merry-go-round of market cycle talk ultimately leads us to this point: does it really matter today?
There are reasons to argue for continued market strength – a strong domestic economy, lower taxes, consumer & business confidence, and record corporate sales & earnings. Headwinds include rising short-term rates and yield curve flattening, dollar strength, tariffs, and rising labor & input costs. Whichever side you take, these are more meaningful evaluations that transcend the status of the current bull market.
Investment decisions based on a systematic plan are likely to yield better odds of success than decisions influenced by noise. A plan to manage downside risk should remove emotion from the equation. Measuring the status of the current market cycle offers little value in isolation. A market cycle’s age is an ineffective indication of its remaining life expectancy.
The post Bull or Bear – Does it Matter Today? appeared first on Catalyst Tactical Allocation Fund Blog.

