Key Summary:
- AAII Consumer Sentiment reaches a bearish extreme, last seen at the December lows.
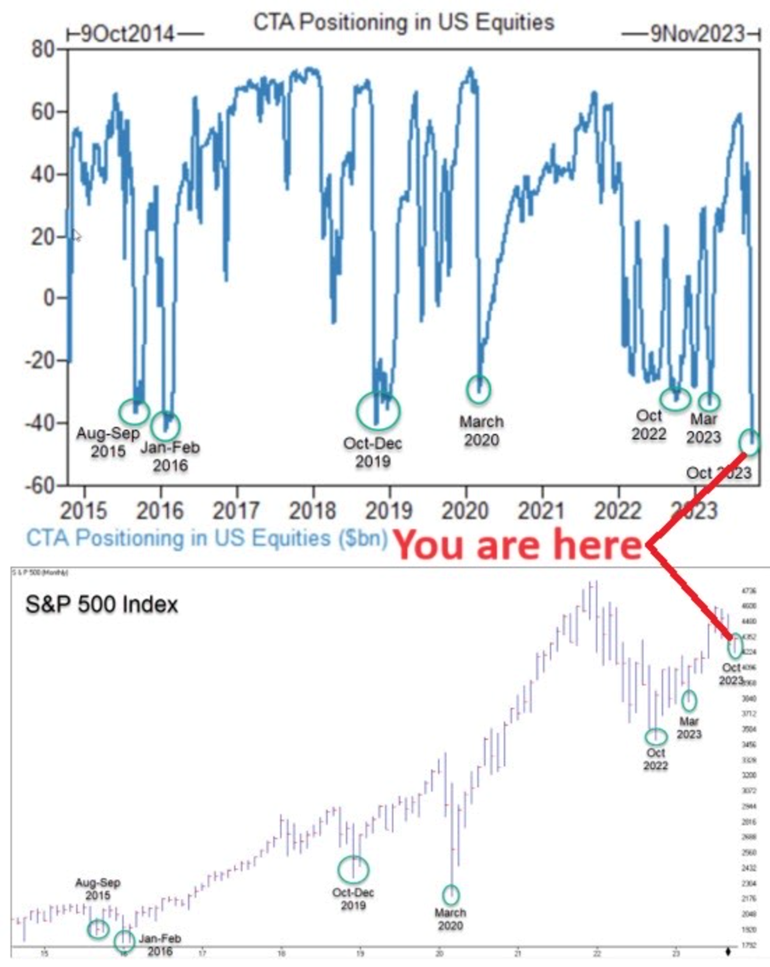
- CTA short positioning in U.S. equities is now extreme.
- Seasonality is now positive and there’s already been significant damage under the hood.
Important thesis: If equities generate roughly 8-10% a year over time, the leaders of industry should, in theory, compound at 13%+ over time. We have significant proof on this topic where top brands are concerned. For a variety of reasons, the last few years has been difficult for the average stock. If buying low and selling high is still a solid approach, investors are getting some wonderful buying opportunities today. And remember, when you’re really bearish, that’s usually a pretty good contrarian signal when this sentiment is very crowded as it is today.
Current AAII Retail Investor Sentiment is Bearish, typically a Contrarian Signal.
As an investor in leading companies, I get paid to analyze the micro and macro factors driving markets. Here’s the reality, there’s always something to worry about. Our team analyzes a massive amount of data every week, one of which is consumer and investor sentiment readings. One report I always enjoy getting is the AAII individual investors’ stock sentiment survey. In yesterday’s report, 50.3% of investors reported they are bearish on stocks. For reference, the historical average for bearishness is 31% so investors are 62% more bearish than they generally are. When readings like this get to extreme levels, they tend to be pretty good contrarian signals. FYI, the last time this group was as bearish as they are today, was December 21, 2022. Below, I have posted how the S&P 500 and the Nasdaq 100 performed since then. Not too shabby.

CTA’s & Trend Followers are Positioned Against Stocks.
Whether we like it or not, systematic, rules-based investors make up a large part of the overall market and daily trading volume. They matter and we must pay attention to their positioning. Like other datapoints, at extremes, crowded trades offer strong contrarian opportunities. Witness what we are seeing over the last few days in the interest rate complex. Positioning for rates to continue rising was about as crowded a trade as I’ve ever seen. It’s now unwinding, at least for now. The chart below highlights the equity positioning across the CTA segment with roughly $25 billion in net short positioning. As you can see, this is a pretty extreme level over history. As you can also see from Sentimentrader.com, extreme positioning tends to be a pretty solid contrarian opportunity for investors. With markets rallying strongly over the last few days, it’s clear there’s some significant short covering happening in this group.

Positive Seasonality Has Begun. Most stocks are down 2 years in a row.
If you’ve been paying attention to market data or your full portfolio this year, you know the average stock, equity fund & ETF, has struggled mightily in 2022 and 2023. Almost two years of below average performance is a very rare phenomenon. In a recent Ned Davis report, they highlight a drought of returns like the one we have seen over the last 21 months tends to bode well for the forward 12 months. “Years with zero record highs have historically seen a median gain of +13.1% the following year.” In addition, we also have the “third year of the presidential cycle positive seasonality” ahead. All at a time when most small and mid-cap companies already reflect a difficult economic environment. With valuations being re-set and sentiment historically poor, I suspect markets perform much better than people expect, even if the returns are more volatile on a day-to-day basis.
Disclosure: The above report is a hypothetical illustration of the benefits of using a 3-pronged approach to portfolio management. The data is for illustrative purposes only and hindsight is a key driver of the analysis. The illustration is simply meant to highlight the potential value of building a consumption focused core portfolio using leading companies (brands) as the proxy investment for the consumption theme. This information was produced by Accuvest and the opinions expressed are those of the author as of the date of writing and are subject to change. Any research is based on the author’s proprietary research and analysis of global markets and investing. The information and/or analysis presented have been compiled or arrived at from sources believed to be reliable, however the author does not make any representation as their accuracy or completeness and does not accept liability for any loss arising from the use hereof. Some internally generated information may be considered theoretical in nature and is subject to inherent limitations associated therein. There are no material changes to the conditions, objectives or investment strategies of the model portfolios for the period portrayed. Any sectors or allocations referenced may or may not be represented in portfolios managed by the author, and do not represent all of the securities purchased, sold or recommended for client accounts. The reader should not assume that any investments in sectors and markets identified or described were or will be profitable. Investing entails risks, including possible loss of principal. The use of tools cannot guarantee performance. The charts depicted within this presentation are for illustrative purposes only and are not indicative of future performance. Past performance is no guarantee of future results.

