Key Points
- Bear markets in consumer & tech stocks happen sometimes.
- From peak 2007 into the Global Financial Crisis to the trough in 2009, consumer stocks underperformed.
- Consumers go down but they don’t tend to stay down.
There is no right or wrong way to build an investment portfolio. Rather than spreading money across style boxes simply using backward looking performance data, which is a typical approach, we think there’s a more thoughtful strategy that can add attractive diversification benefits and enhance returns over time. Loosely, this strategy is named, “thematic investing.”
In the real world, when you build a solid foundation for a house, it is better equipped to withstand any wild storms that may happen over long periods of time. In last week’s blog, I referenced the definition of “core” being the “central and most important part of something.” From an investment perspective, the “core” of the portfolio should be an important driver of the country in which we invest. To keep the foundation of the portfolio sturdy, including highly profitable companies with high market share, significant competitive advantages, and generators of strong free cash flow is one prudent idea. Loosely, our industry calls these kinds of companies, blue chips. However, we call them mega brands. Regardless, if the core of the portfolio is leading blue-chip stocks or brands, the foundation can withstand storms like we have today. This doesn’t mean that the foundation won’t be under stress, it just means the foundation has much better odds of not crumbling when real storms arise. The Great Financial Crisis in 2008-2009 offers a great example of this metaphor. Most companies and mega brands struggled in this difficult period because the economy was in a deep recession and stocks do not tend to perform well in recessions. Ironically, the actual businesses of the best blue chips and iconic brands tend not to deteriorate to the same degree as their stock prices. This is important because once the economy and markets trough, these great companies tend to rise higher as money seeks great businesses on sale. That seems quite important now. Between now and the next 4-6 months, we are getting some of the best long-term entry points in blue chip brands we have seen since 2009. It’s very important to understand how powerful a blue-chip core allocation is and why it’s wise to build bigger positions in this core as stocks and the economy struggle.
The Consumer is the Core of the Economy. Consumer Stocks are an Ideal Core Holding.
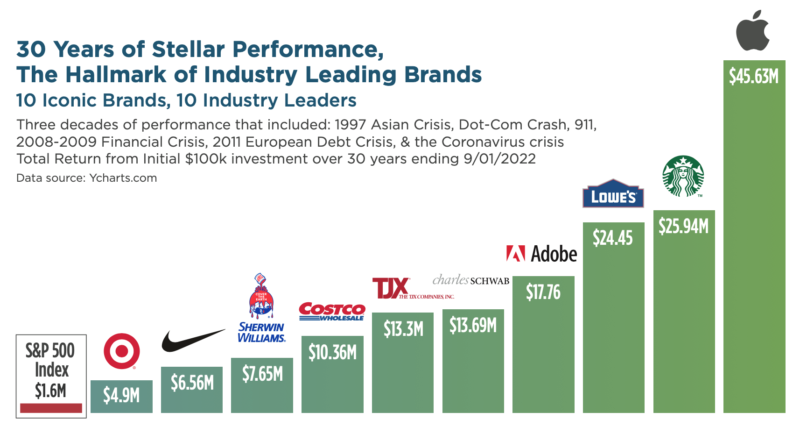
Every sector includes strong and weak companies. The leading companies or brands tend to be less volatile and solid performers over time. The leading Consumer Discretionary brands serving the U.S. and global consumers have compounded at some significant rates as they evolve into global dominance. I’ve attached the below chart again as a constant reminder of the stellar returns generated by some of the leading brands over the last 30 years. To receive those gains, one had to be committed to holding these great companies through tough economic times. Adding to positions when they go on sale offers even more financial benefits over time.
Could there be a better core group of holdings than the blue-chip brands that are likely a part of your everyday life?

Data source: Ycharts.com
Consumer Discretionary Stocks, Like Other Sectors, Can Be Volatile at Times
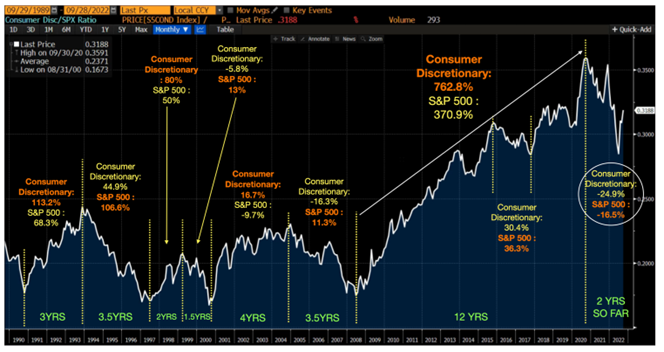
No sector outperforms every year. Even the greatest athletes on earth need a rest sometimes. Below, I have attached the long-term chart of the Consumer Discretionary sector in the form of a ratio chart. Ratio charts compare one asset to another. When the line is rising, the first asset is outperforming the other. When the line falls, the first asset is underperforming relative to the second. In this example, I’m using the Consumer Discretionary sector Index versus the S&P 500 Index. As you can see, over the long-term, the consumer stocks have tended to trend up versus the S&P 500 but there were periods when the market outperformed the consumer. In the graph, I have shown how the consumer stocks and the index have performed during these up and down periods. The up/down periods offer a not-so-subtle reminder that when an asset tends to outperform, you add to it when its underperforming. Why? Because adding in these periods just assures you have more exposure into the next outperformance period. Today, we have one of those buying opportunities and periods of underperformance.
The ratio chart covers 9/29/89 to 9/28/2022, 30+ years.

Data source: Bloomberg and Accuvest.
There are a few things to note from the above chart:
-
Consumer stocks have performed well versus the S&P 500 over the long-term.
- Between 9/28/1990 and 9/28/2022, consumer stocks outperformed the S&P 500 by about 123bps per year. Consumer Discretionary delivered a cumulative return of 3214% versus the S&P 500 at 2230%.
- Between 9/28/1990 and 9/28/2022, consumer stocks outperformed the S&P 500 by about 123bps per year. Consumer Discretionary delivered a cumulative return of 3214% versus the S&P 500 at 2230%.
- It’s important to note that the above data is the index, not what the best of the best brands have done over time. Look above at the image with the 30-year track records of a sub-segment of the index, the best brands have performed much better than the index. Our focus is on the most relevant brands because when you dominate a category, you reap most of the financial rewards.
- The outperformance generated over the long-term has not happened in a linear fashion. Sometimes it was valuations that held consumer stocks back and sometimes it was an over-levered consumer. No one knows the future, but with the knowledge of how the movie ends, one shouldn’t get too scared during periods when the boogey-man comes out of the closet. Yes, I had to add a Halloween metaphor so close to 10/31.
Stock Picking Matters: Examining the 2009-2021 Bull Market Run
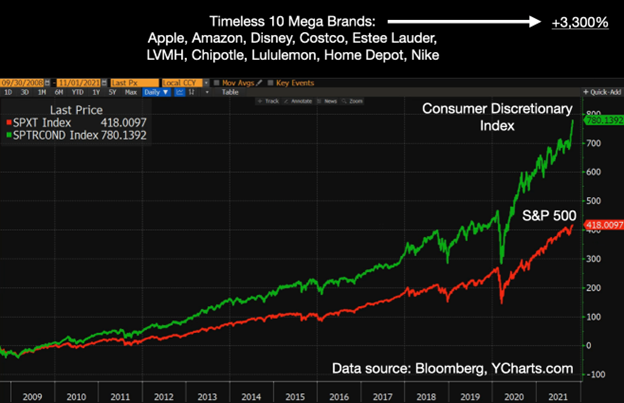
In the chart showing the consumer stocks versus the index over a 30+ year period you can see one period where significant outperformance occurred. There were many reasons why consumer stocks outperformed so handily in most of the years, but I want to drive home the benefits of picking mega brands over the index. From mid-2008 through November 2021, when the consumer stocks handily outperformed the market, a smaller and focused group of important brands performed even better. We call this group the “Timeless 10” megabrands. It’s important to note that even these great brands can underperform on occasion. But, so long as they stay highly relevant, they tend to perform quite well versus index options over full market cycles.

SUMMARY:
In a consumer-led U.S. and global economy, the leading companies or brands naturally should have strong opportunities to serve consumers over time. That should lead to above-index returns for the greatest brands around the world. Outperformance in anything is never linear, it comes with fits and starts. In periods of underperformance, it’s easy to get bored and want to move on and high volatility can shake people out of their holdings. Don’t let yourself get shaken out of great companies. Rather, use the opportunity to get more exposure. Being willing to cost average on big dislocations simply quickens the recovery time when “normalcy” returns. As you can see in the chart above, a focused basket of mega brands that serve key spending categories has significantly outperformed an index that has a history of generating alpha. Mega brands matter in good times and in bad times.
Disclosure:
This information was produced by Accuvest and the opinions expressed are those of the author as of the date of writing and are subject to change. Any research is based on the author’s proprietary research and analysis of global markets and investing. The information and/or analysis presented have been compiled or arrived at from sources believed to be reliable, however the author does not make any representation as their accuracy or completeness and does not accept liability for any loss arising from the use hereof. Some internally generated information may be considered theoretical in nature and is subject to inherent limitations associated therein. There are no material changes to the conditions, objectives or investment strategies of the model portfolios for the period portrayed. Any sectors or allocations referenced may or may not be represented in portfolios managed by the author, and do not represent all of the securities purchased, sold or recommended for client accounts. The reader should not assume that any investments in sectors and markets identified or described were or will be profitable. Investing entails risks, including possible loss of principal. The use of tools cannot guarantee performance. The charts depicted within this presentation are for illustrative purposes only and are not indicative of future performance. Past performance is no guarantee of future results.
The Chipotle hypothetical cost averaging example highlights the potential power of holding core positions in industry leading brands and being committed to adding to these positions when the market acts irrationally. Cost averaging leading companies can add significant value to your long-term portfolio even if you do not catch the absolute bottom in the stock. Details on this hypothetical are below.

