One of the most asked questions in my meetings with clients is whether an allocation to the global consumer should be viewed as a sector allocation decision (satellite) or a primary portfolio allocation decision (core). Generally speaking, a sector investment tends to be a smaller allocation when compared to the core portfolio allocations. To answer the question, let’s define some of these terms to see if the data can help us decide what the answer might be.
Sector Investments
Sector investments are defined in the dictionary as a “subdivision or portion of something.” From an investment perspective, I read that to be a satellite allocation, or smaller allocation relative to the bigger allocation decisions that happen in a typical portfolio. In my experience, if one does do sector investing around the core, the most popular sector tends to be technology. Why? It’s one of the top performers so money chases backward looking returns plus technology is at the center of everything we do these days, so it seems to be an easy decision for allocators. For risk averse investors, the “low volume” sectors have also been very popular over the last three years.
I asked some of my Financial Advisor friends, what percent of their typical client portfolio sector investments make up and largely the number was between 5%-15% of the total equity weight if they use them at all. Looking backward, adding dedicated technology exposure was a very smart portfolio decision but here’s a fun fact to consider.
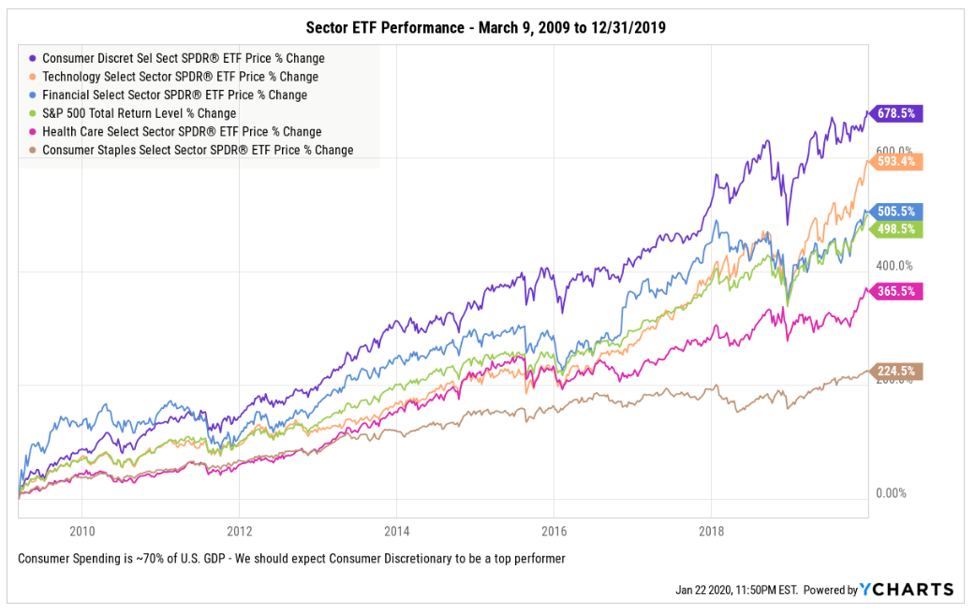
Since the generational low on March 9, 2009, the tech sector measured by the XLK ETF was the second-best performer (as of 12/31/2019) +593% versus the S&P 500 as measured by the SPY ETF at +498%. What was the top performer you ask? Consumer discretionary as measured by the XLY ETF at+ 678%.

If the consumer and consumer spending accounts for ~70% of U.S. GDP and the economy has been in a bull trend since the financial crisis, even though we have the occasional correction, it seems quite reasonable and almost expected that consumer discretionary stocks should be a top performer simply because the consumer is such an important driver of economic output. Here’s where it gets fun, even when the consumer slows down and the stocks struggle for a while, the consumer staples stocks have a history of protecting capital given their defensive qualities. As the manager of a consumer strategy, I like knowing I can pivot from discretionary brands and add to staples brands in times of turmoil. Additionally, consumer discretionary stocks are often the first asset class to bounce back from economic slowdowns. Why? Because spending is in our DNA. It’s the core of our lives and there’s a 50+ year track record of the consumer driving this economy.
Core Investments
Core investments are defined in the dictionary as a “the most important part of something.” From an investment perspective, the core investments should likely be attached to the most important drivers and themes of the economies in which we invest. If the consumer drives ~70% of U.S. GDP and 60% of world GDP, that sounds like the consumer should be viewed as a core allocation rather than a sector, or part of the whole.
It’s here that the real disconnect is exposed. Most advisors and likely their customers think about the consumer as just another sector and if not, every investors portfolio holds sector investments, it’s quite likely the average investor is underweight the single largest driver of the economies in which they invest. Since we know the consumer discretionary stocks, in aggregate, have been the top performers since March 2009, being under-exposed to them seems to have been a bad decision.
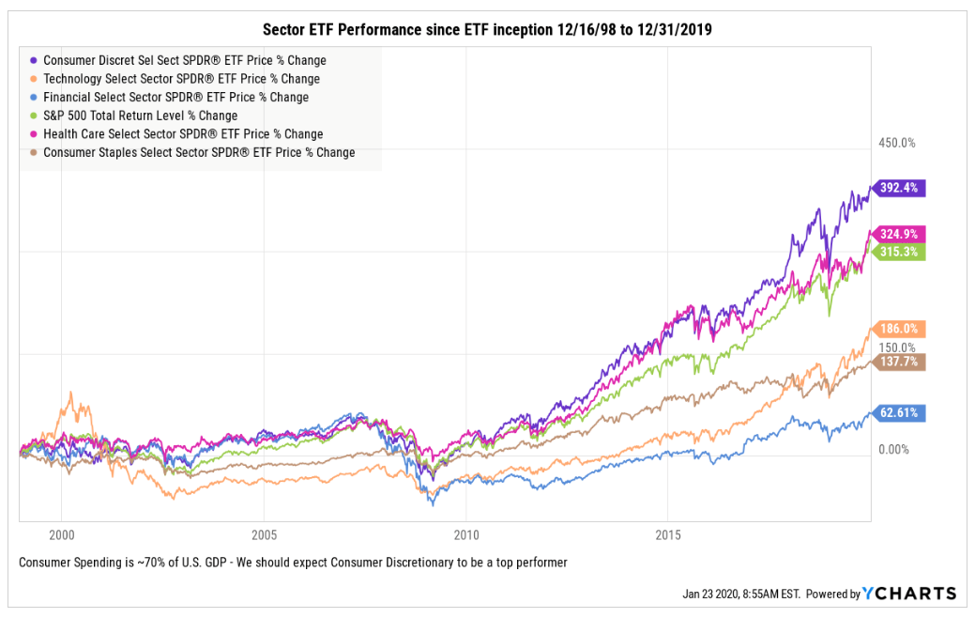
Let’s widen the lens a bit and look at the ETF’s back to inception 12/16/1998. There seems to be come consistency as the consumer discretionary stocks are the top performer as well as of 12/31/2019. Consumer discretionary stocks as measured by the XLY ETF are up +392% versus the S&P 500 +315% and technology comes in at +186%, lower given the bursting of the Tech bubble in March 2000. In a consumer economy should this be expected? I think so.

Total addressable market (the opportunity set) comparisons: Technology versus Consumer Discretionary
Since we know the tech sector is the most popular by far from an investment assets perspective, let’s see what kind of total addressable market opportunity we have. Tech has become a staple of our personal and business lives so holding chunky allocations to tech seems smart. I’m not sure investors need a separate tech allocation given how large the allocation to tech is inside the most popular index ETF’s and the high allocation to tech inside most active mutual funds. Pretty much every growth fund has a healthy overweight to the tech sector so it’s quite likely that the average investor has tech well covered in a portfolio.
Size matters. There are many sub-sectors within what is loosely known as tech but the most talked about opportunities inside tech are Artificial Intelligence, Cloud Computing, Big Data, Internet of Things, and Software. Collectively, the total market opportunity for these key sub-sectors is approximately $1.6 trillion based on recent data from GlobalNewswire. That’s a big opportunity and it’s global in scope and we aren’t going backward so there’s an important long-term theme opportunity investing in top technology stocks.
Let’s compare the estimated current $1.6 trillion tech opportunity to the global consumer spending opportunity.
Global consumer spending opportunity
If 70% of U.S. GDP is consumer spending, that’s about $14 trillion today. U.S. retail sales alone is about $5.5 trillion per year. So, the U.S. consumer spending theme is multiple times larger and I would argue more predictable than the cyclical opportunity in technology. Let’s look outside the U.S. McKinsey states household spending accounts for 60% of world GDP. World GDP is roughly $74 trillion so 60% of $74 trillion is $44 trillion. Deduct the U.S.’s $14 trillion and the consumption opportunity outside the U.S. is an additional $30 trillion dollars.
Bottom Line:
Here are some bottom-line takeaway points to consider:
- I cannot find any single theme that can come close to the size and predictability of the consumer spending theme, here and abroad.
- If the definition of CORE is the “the most important part of something,” it seems the consumer is the mother of all core portfolio opportunities.
- The real opportunity for investors is to right size their allocation to the consumer because by every measure I can find, most portfolios are chronically underweight the consumer. In a former blog post we analyzed the assets in sector ETF’s and active funds and there’s a fraction of the assets in consumer-focused products when compared to other sectors.
- Using history as a guide and adding some common sense, implementing a consumer spending allocation as the core driver of your portfolio could have significant total return implications.
DISCLOSURE:
This information was produced by and the opinions expressed are those of the author as of the date of writing and are subject to change. Any research is based on the author’s proprietary research and analysis of global markets and investing. The information and/or analysis presented have been compiled or arrived at from sources believed to be reliable, however the author does not make any representation as their accuracy or completeness and does not accept liability for any loss arising from the use hereof. Some internally generated information may be considered theoretical in nature and is subject to inherent limitations associated therein. There are no material changes to the conditions, objectives or investment strategies of the model portfolios for the period portrayed. Any sectors or allocations referenced may or may not be represented in portfolios managed by the author, and do not represent all of the securities purchased, sold or recommended for client accounts. The reader should not assume that any investments in sectors and markets identified or described were or will be profitable. Investing entails risks, including possible loss of principal. The use of tools cannot guarantee performance. The charts depicted within this presentation are for illustrative purposes only and are not indicative of future performance. Past performance is no guarantee of future results.

