We generally believe there is a place and time for most structured annuity segment types given their hedge characteristics and the strong levels of definition that clients truly appreciate. In fact, we discussed the benefits and detriments of Structured Annuities as well as how these products are constructed in our recently published “Under the Hood” video segment (part 1 and part 2) and associated blog posts. However, there is one type of segment that ALL clients should stay away from; The 5+ year 10% buffered annuity based on the S&P 500 should not be touched. And here is why:
Over the last 10 years the S&P 500 has averaged a 2% dividend yield[1]. If one calculates the return of the S&P 500 inclusive of the dividend it is considered the “Total” return. If one excludes the dividend it is considered the “Price” return. When purchasing the underlying stocks of the S&P 500 or a product that seeks to capture the exposure of the S&P 500, such as SPY, the SPDR S&P 500 ETF, the investor will capture the Total return of the S&P 500. However, when purchasing option-based products, like structured note annuities, the dividend is not captured. Performance is based on the Price return of the index.
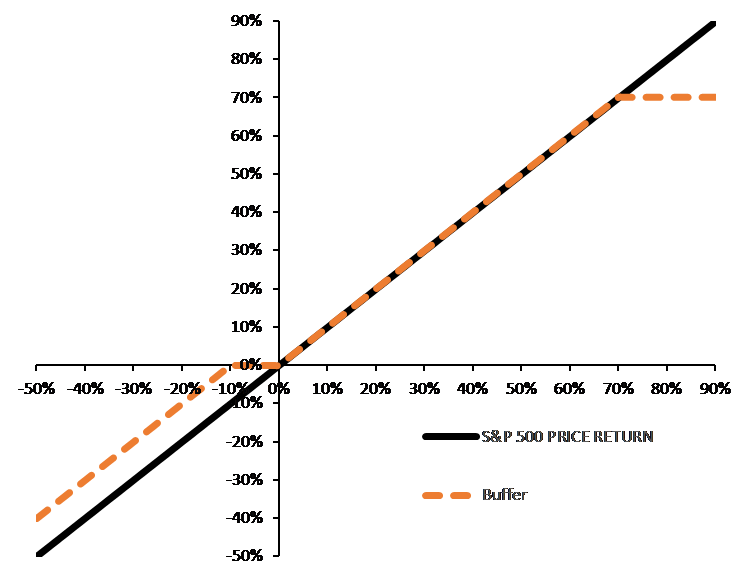
The following graph illustrates the return of a 5 year, 10% buffered structured annuity on the S&P 500 with a 70% cap (the orange dotted line) as compared to the S&P 500 Price return (the black solid line). Against the Price return, the buffered annuity provides a 10% level of protection vs the S&P 500 at maturity only as illustrated by the parallel portion of the orange dotted line. Conceptually, in return for this protection, the investor gives up returns above the cap.

However, as has been established, an investor in the S&P 500 will receive the Total return at maturity. Over a five-year period, an investor in the S&P 500 can expect to receive approximately 10% in dividend payments. The graph below swaps out the S&P 500 Price return for the Total return, essentially shifting the whole line up 10%. As can be seen, there are no instances where the buffered annuity outperforms the S&P 500.

Buffered products are generally constructed to provide a hedge to the downside in return for a limit in participation on the upside. It is important to understand and appreciate that level of hedge. For example, we compare a 10% buffered annuity with a one-year maturity to that of a five-year maturity in our under the hood video, which highlights the material benefits of the shorter duration product’s hedge characteristics despite an identical headline buffer of 10%.
When dealing with a 10% buffered annuity with duration of 5+ years, the investor will always lose or at best come out even, regardless of cap level (or even if there is no cap). When considering liquidity, access, paperwork and the like there should be no consideration for these buffered annuities. The following table illustrates expected returns at maturity for various scenarios to drive home this point. The yellow highlighted area represents where an investor would expect to have similar returns regardless of the product while the green highlight area represents where the investor would out-perform by selecting SPY over the buffered annuity.
| S&P 500 Price Return |
-30% |
-10% |
-5% |
0% |
10% |
50% |
100% |
| 5 Yr. 10% buffer; 70% cap |
-20% |
0% |
0% |
0% |
10% |
50% |
70% |
| SPY Total Return (Est) |
-20% |
0% |
5% |
10% |
20% |
60% |
110% |
In summary, it is always important to fully appreciate the hedge provided for a product in context to other investable securities that may provide similar or identical exposures. When dealing with structured annuities, either participate in shorter duration products or increase the hedge level the longer the duration. But in no way should you put your client in a 10% buffered annuity with a 5+ year duration.

