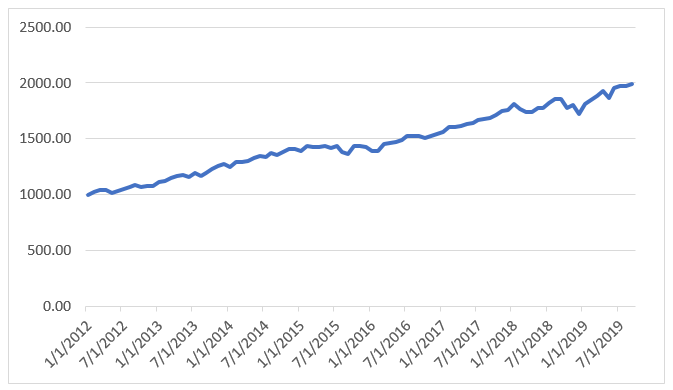
Since the start of 2012, traditional 60/40 stock and bond portfolios have fared extremely well. That said, I think it’s natural for investors to lump stocks and bonds together, especially when looking at portfolio performance. However, if you separate bonds out and look at bond-specific returns, there’s doubt that they’ll be able to deliver the same kind of performance again.
60% S&P 500 / 40% Bloomberg Barclays U.S. Aggregate Bond Index

| 60/40 | |
| Annualized Return | 9.4% |
| Worst Decline | (8%) |
| Volatility (Annualized Monthly) | 6.6 |
Source: Bloomberg
Year-to-date, returns from bonds have far and away been some of the best since the beginning of 2012. But overall characteristics of bonds at the end of September 2019 versus where they stood at the end of 2018 suggest that future returns aren’t looking as good for bonds.
| 9/30/2019 | 12/30/2018 | Change | |
| Yield (in %) | 2.27 | 3.28 | -1.01 |
| Duration (Option Adjusted in Years) | 5.7 | 6.1 | -0.4 |
Source: Bloomberg Barclays US Aggregate Bond Index
My previous statement is further proven by the following three key points:
- As of the end of September, yields are a little over 100 basis points (bps) lower than at the end of last year; significantly lower yield combined with less room to fall further means paltry potential for future return.
- The credit sensitive part of the bond index has seen credit spreads compress around 25 bps. This means that corporate bonds should have lower prospective returns because of the decline in overall yield and the smaller extra yield pickup they provide versus U.S. Treasurys.
- The reduced duration means that bonds will have a smaller price increase than compared to before because interest-rate sensitivity is lower.
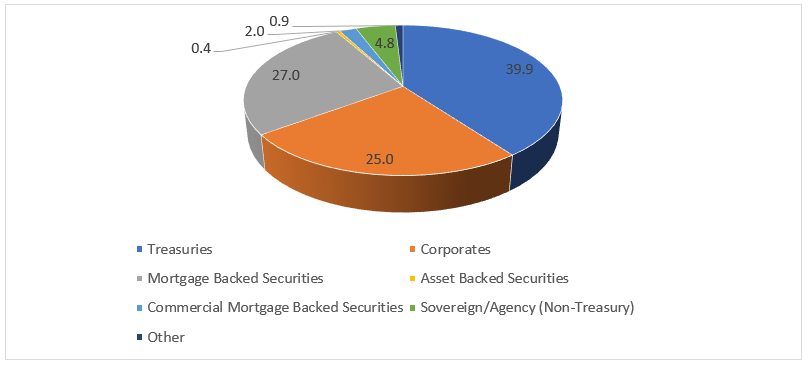
To lay it out simply, I believe that overweighting other fixed income sectors can deliver better return characteristics going forward. The charts below illustrate the composition of the Bloomberg Barclays U.S. Aggregate Index versus a bond portfolio concentrated in non-agency mortgage credit.
Bloomberg Barclays U.S. Aggregate Bond Index Composition

Source: Bloomberg Barclays U.S. Aggregate Bond Index Composition
Mortgage Centric Bond Portfolio

Source: Bloomberg Barclays U.S. Aggregate Bond Index Composition
The money is in mortgage credit!
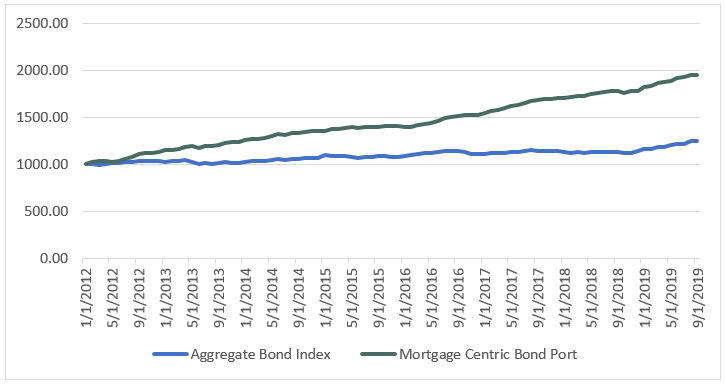
Comparing historical returns of a bond portfolio mimicking the U.S. Bloomberg Barclays Aggregate index versus a mortgage credit centric portfolio shows that the mortgage credit portfolio has delivered greater returns with even lower volatility and peak-to-trough declines suffered.
Mortgage Centric Bond Portfolio vs Bloomberg Barclays US Aggregate Bond Index

Source: Bloomberg Barclays
With lower yields and tighter corporate credit spreads (particularly the high yield sector), I think that the wider spreads available in the mortgage credit sector – in both residential and commercial – continue to offer better prospective returns. Not only does the mortgage credit sector tend to have lower duration and many bonds have floating rate coupons, but this sector has historically been much less correlated to other equity and fixed income investments. Furthermore, due to technical supply and demand, mortgage credit is likely to hold up better than the high yield sector in any global market weakness. High-yield and investment-grade corporate issuance has consistently doubled since 2007. Comparatively, net new issuance in non-agency residential mortgages has been negative. Legacy non-agency mortgages are paying down at a rate that has historically been greater than new issue.
And with a hybrid portfolio, the addition of a tactical component to this mortgage centric portfolio rounds out performance to surpass even the higher yielding fixed income sectors, such as high-yield bonds. What this extra component does also is set up this investment to potentially perform better if we experience greater market volatility over the next five years than what we’ve had the previous.
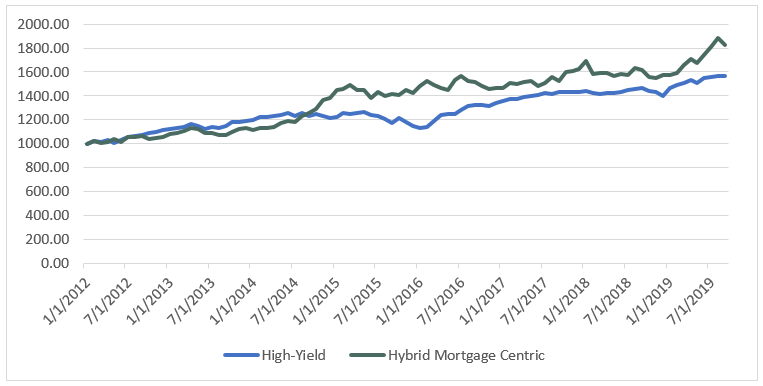
In the chart below, let’s examine how this hybrid bond investment compares in performance to the high-yield index.
Hybrid Mortgage Centric Portfolio vs. High-Yield Bonds from 2012-2019

| Hybrid Mortgage Centric | High-Yield | Comparison | |
| Annualized Return | 8.2% | 6.0% | HIGHER |
| Worst Peak-to-Trough Decline | (8.3%) | (10.3%) | LOWER |
| Correlation to S&P 500 | 0.2 | 0.7 | LOWER |
Source: Bloomberg
Compared to high-yield bonds, the hybrid bond investment delivers significantly greater return with a smaller peak-to-trough decline. Continuing in 2019 as the equity markets have surged higher in 2019, the hybrid bond investment has again outperformed. Turbulent periods show that reaching for yield with high-yield bonds comes at a cost: these bonds don’t tend to diversify one’s portfolio in times of market stress – actually, quite the opposite. The hybrid mortgage centric bond investment, though, fared better by outperforming high-yield bonds by over 2% in the fourth quarter of 2018.
It’s important to remember that the superior and stable recent returns from traditional stock and bond portfolios have come amidst historically low market volatility. Any diminution in bond or equity returns going forward could see a portfolio with this type of hybrid bond investment far surpass results from traditional portfolios.
Disclaimer
The performance data displayed herein is compiled from various sources, primarily Bloomberg. Portfolios are comprised solely of benchmark indices and are rebalanced monthly except where noted otherwise. Benchmark index performance shown is primarily from Bloomberg Barclays indices. Exceptions are S&P 500 for U.S. equities, Societe General CTA Index for managed futures and Markit Non-Agency MBS for non-agency MBS. These indices are for the constituents of that index only, and do not represent the entire universe of possible investments within that asset class. And further, that there can be limitations and biases to indices such as survivorship, self-reporting, and instant history. Past performance is not indicative of future results.

