

I was recently moderating an Advisor branch lunch presentation and a “light bulb” went on for the group of 25 Financial Advisors in attendance. In fact, it was such an “ah-ha” moment for them that a few came up to me after the presentation and asked if I would put the presentation in written format so they could use it with clients. Accordingly, please enjoy this week’s blog post.
During the presentation, the following setup was given to the group:
Questions #1: What is the primary driver of U.S. economic prosperity? Consumers via their spending.
Question #2: Does that ever change? No.
Question #3: Is that a U.S.-only phenomenon or is it prevalent outside the U.S.? It’s global, 60% of world GDP is household spending.
Question #4: Is predictability and stability a good thing? Yes indeed.
Question #5: If the definition of “core” from the dictionary is “the most important part of something” does a consumer spending dedicated strategy offer a great core portfolio choice? Seems so.
Let’s see if the logic translates into attractive returns below.
35 Key Consumer Spending and Time Spent Categories Using Today’s Dominant Brands
It’s sad and exhilarating to go through your monthly bills at year end to see where you spent your money. There are the “staples of life” and the “discretionary purchases” and they roll up into our yearly spend. Do that analysis for hundreds of millions of people in the U.S. and billions of people outside the U.S. and some great companies start rising to the top. These great companies that are dominating the important spending categories using the current trends we see, should in theory have been a pretty good group of stocks to own for a core portfolio over the last decade.
To illustrated this, here’s 35 important spending categories and the dominant, highly relevant brand today based on our Brand Relevancy Scoring System (important: In categories where there were multiple brands dominating, I chose the one with at least a 10-year record of being a public company so there is some subjectivity involved):
- Cell phones & consumer technology – Apple
- Internet Search – Google
- Social Media – Facebook
- Coffee & Fast Casual – Starbucks
- Home Improvement Retail – Home Depot
- Athleisure Apparel – Lululemon
- Footwear & Apparel – Nike
- Fast Food – McDonald’s
- Video Streaming – Netflix
- Cosmetics & Beauty Supplies – Estee Lauder
- Credit Cards, Rewards Programs – America Express
- Warehouse Shopping – Costco
- Online Shopping & E-Commerce – Amazon
- Discount, Off-price Apparel – TJ Maxx
- Video Gaming Consoles, Personal Computing & Corporate Operating Systems – Microsoft
- Cable & Internet Service Providers – Comcast
- Healthy Fast Casual Restaurants – Chipotle
- Household Products like Toothpaste, Cleaning Supplies, Personal Care – Colgate-Palmolive
- Packaged Food Products, Chocolate – The Hershey Company
- Discount Retail Stores – Dollar General
- Soft Drinks – Coca-Cola
- Alcohol, Beer, and Wine – Constellation Brands
- Movies, Entertainment, Leisure Travel – Walt Disney
- Personal Healthcare & Baby Products – Johnson & Johnson
- Sustainable, Environmentally Friendly Auto’s – Tesla
- Everyday Personal Care Products – Proctor & Gamble
- Packaged Foods – Cereals and Quick Meals – General Mills
- Automotive Parts Retailing – O’Reilly Automotive
- Toys & Games – Hasbro
- Paint & Supplies – Sherwin Williams
- Managed Healthcare Providers – United Healthcare
- Packed Foods – Spices and Eat-at-Home Supplies – McCormick & Company
- Big-Box, Discount Retail – Walmart
- Cell Phone Service & Telecom Needs – Verizon
- Business & Leisure Hotel Stays – Marriot
Keep in mind, I did not even include some of today’s most important categories & Mega Brands like video Gamers, Visa, Mastercard, Banking with J.P. Morgan, E-Commerce platform winner Shopify, etc. I could easily have cherry-picked some of the most robust stock winners of the last 5+ years for the above analysis but I wanted this to be as real-world as possible. Importantly, there’s about 50% exposure to categories that offer more defensive qualities than offensive qualities so this isn’t even a complete bull-market, hindsight portfolio because in theory, I wouldn’t want to have 50% exposure in defensive equities if I knew with certainty I was investing in a raging bull market. The “staples of life” categories and brands have historically lagged in bull markets and thrived in economic slowdowns, while offering stability in difficult markets as money flows to these “needs” categories.
10-Year Look Back
Understanding the inherent hind-sight bias in this exercise, this illustration is still highly valuable as a reminder that the spending we do as human beings can also offer a portfolio advantage when we track brand relevancy and are willing to own the brands that become the leaders as our purchase habits change over a lifetime. Here’s the characteristics of this hypothetical consumer spending brands model portfolio:
- 35% Consumer Cyclical exposure
- 31% Consumer Defensive exposure
66% in traditional consumer stocks looks a lot like the 60% of world GDP data & 70% of U.S. GDP data we cite often. This allocation better tracks the real economy as a Core portfolio when compared to the S&P 500, which is supposed to be the proxy investment for the economy. Let’s see if this approach can offer an edge over the S&P 500.
10-Year Performance Look-Back Source (Powered by Y charts)
Below is the hypothetical, equal-weighted portfolio of the above leading brands serving 35 consumer spending categories. The performance chart below shows this static portfolio rebalanced annually back into the same 35 stocks.
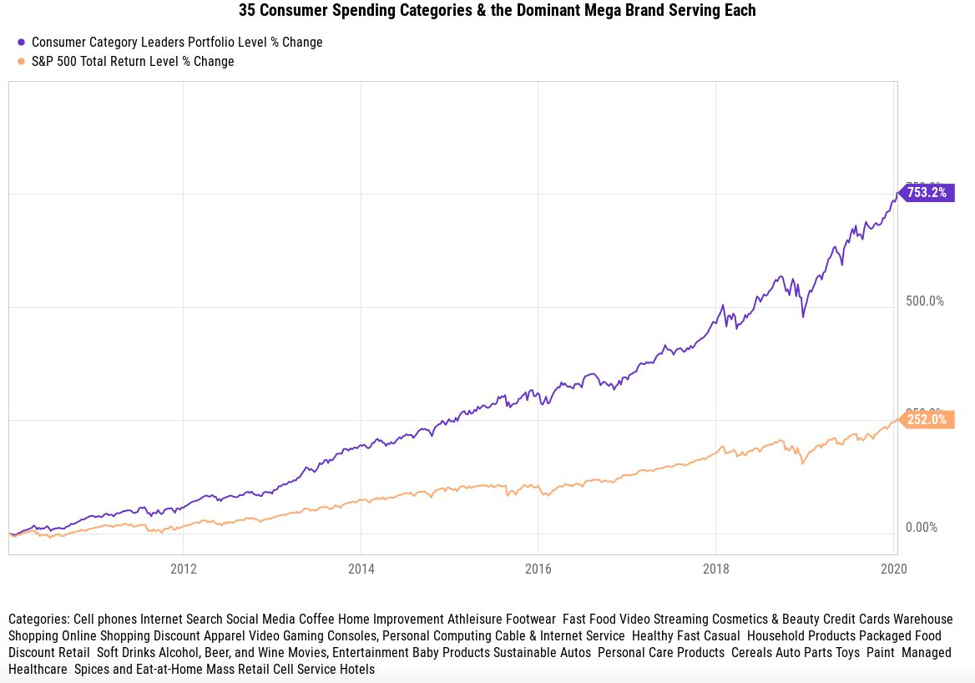
Reminder, over time, brand relevancy will change most of these brands have largely been the dominant companies in their business categories for many decades. The hypo portfolio above performed really well, not a big surprise given this is a consumer economy that’s out of recession more than in. But let’s see the portfolio metrics and risk metrics.
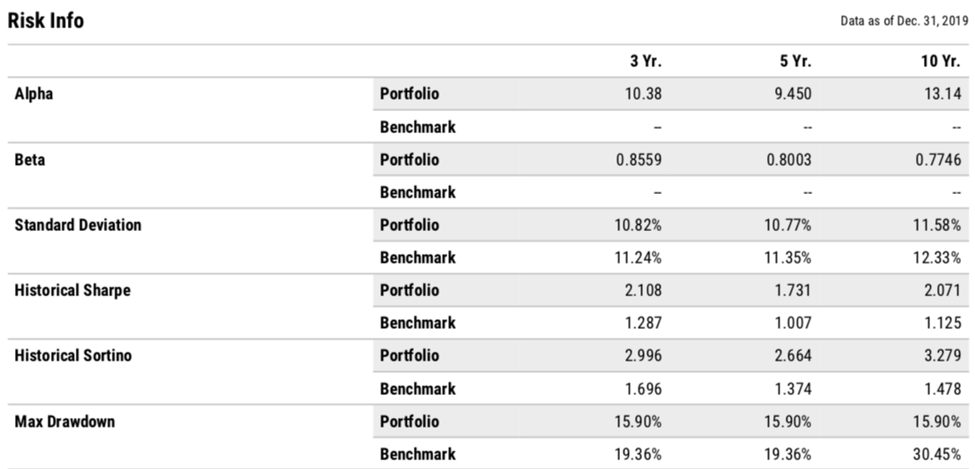
Not so bad. The 35-stock portfolio performed well and offered a seemingly smoother ride, likely because it’s about half filled with defensive type stocks. I call that having your cake and eating it too!
The Bottom Line:
The following are some bottom-line takeaway points to consider:
- Peter Lynch, the best mutual fund manager of our time focused on “invest in what you know”.
- As consumers, we have unique insights into the brands that are dominating key spending categories because we are the dataset. This knowledge offers significant benefit for investing.
- There can be no better hedge against our lifetime spending than to consider investing in the brands that control our wallet-share and mindshare.
- In aggregate, we call these Mega Brands and they are a wonderful core portfolio option that tracks the real drivers of the domestic and global economies.
- What brands do you spend consistent money on? What brands do you admire? Do you own the stocks in a meaningful way?
Disclosure:
This information was produced by and the opinions expressed are those of the author as of the date of writing and are subject to change. Any research is based on the author’s proprietary research and analysis of global markets and investing. The information and/or analysis presented have been compiled or arrived at from sources believed to be reliable, however the author does not make any representation as their accuracy or completeness and does not accept liability for any loss arising from the use hereof. Some internally generated information may be considered theoretical in nature and is subject to inherent limitations associated therein. There are no material changes to the conditions, objectives or investment strategies of the model portfolios for the period portrayed. Any sectors or allocations referenced may or may not be represented in portfolios managed by the author, and do not represent all of the securities purchased, sold or recommended for client accounts. The reader should not assume that any investments in sectors and markets identified or described were or will be profitable. Investing entails risks, including possible loss of principal. The use of tools cannot guarantee performance. The charts depicted within this presentation are for illustrative purposes only and are not indicative of future performance. Past performance is no guarantee of future results.