In keeping with my last blog post on September 26, 2019, “Nike + The Bull/Bear Line in the Sand,” I would like to address two important themes:
- Equity sentiment via the AAII Bull/Bear Spread; and
- The virtues of tracking important demographic groups and their favorite brands.
I’d like to point out that the bull-to-bear spread is back to levels where forward equity returns have been attractive for investors. The chart below comes from the AAII.com website and tracks their members’ views about what the stock market will do over the next six months. As you might imagine, this data is mostly meaningless when in the middle of ranges but offers a significant contrarian opportunity when either bullishness or bearishness is at extremes. As of October 9, 2019, we have a bearish extreme. While conditions can always deteriorate further making the next reading more extreme, the level of bearishness is at levels where it has historically been wise to fade the fear and buy stocks. None of us know the future but this has been a reliable indicator when at extreme levels such as now.
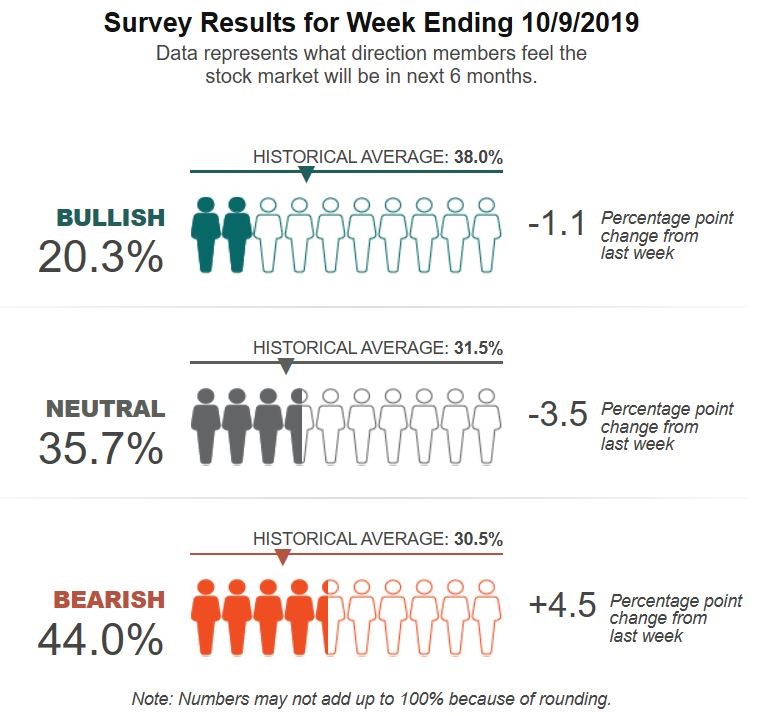
Source: AAII
I like to look at the spread between bears and bulls to see when that also gets to “extreme levels.” This has also been a strong contrarian indicator.
AAII Bull/Bear Spread Back to Extreme Lows not seen since the December 2018 lows and 2015/2016 lows of the mini profit recession.
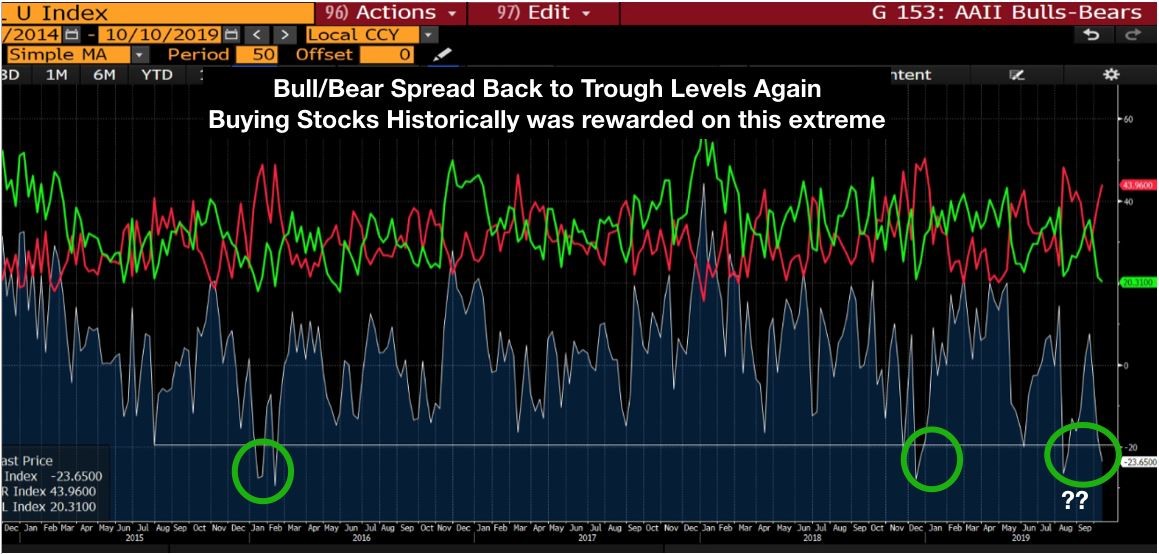
Source: Bloomberg
What happened the last two times the Bull/Bear spread was this low?
- January 1, 2016 to January 1, 2017
-The S&P 500 returned 11.9% for the forward one year.
-The Nasdaq 100 ETF, QQQ (a proxy for growth stocks) returned 7% for the forward one year.
-The Russell 2000 Index via the IWM ETF (a proxy for small cap companies) returned 21.5%.
If you remember, smaller companies significantly underperformed into the 2016 trough so naturally the more cyclical areas of the market performed the best coming out of an economic slowdown. The financials and energy sectors performed well during this period, while growth stocks lagged but were still solidly positive.
- December 24, 2018 until October 9, 2019)
-The S&P 500 returned 22% since the Christmas Eve low.
-The Nasdaq 100 Index via the QQQ ETF returned 28%.
-The Russell 200 Index via the IWM ETF returned 15.7%.
Source: Stockcharts.com.
The bottom line is that nobody knows the future but historically when the AAII Bull/Bear spread gets this extreme, we should be looking to add equity exposure into any weakness versus getting more fearful. Buy low, sell high right?
Another key point is that I’d like to make is that tracking important demographics, teens in this case, can offer strong investment returns.
I track lifetime spending categories through the purchase habits of important demographic groups. Teens, affectionately called Gen-Z currently, are a very large cohort of the U.S. population. The Gen-Z group is as large as the Millennials, which are both larger than the Baby Boomer generation. Baby boomers had a very positive effect on domestic consumption, the stock market and real estate markets during their peak income, spending, and saving periods. Having two large population groups just beginning their spending and saving life-cycle is a very good thing for the brands winning their mind and wallet-share.
Athleisure is a major theme for these two cohorts and the footwear category is one of the most important. Footwear often includes apparel opportunities so the category is a large, important one to track. Here’s what a recent Piper Jaffray report found where Footwear and Teens were concerned:
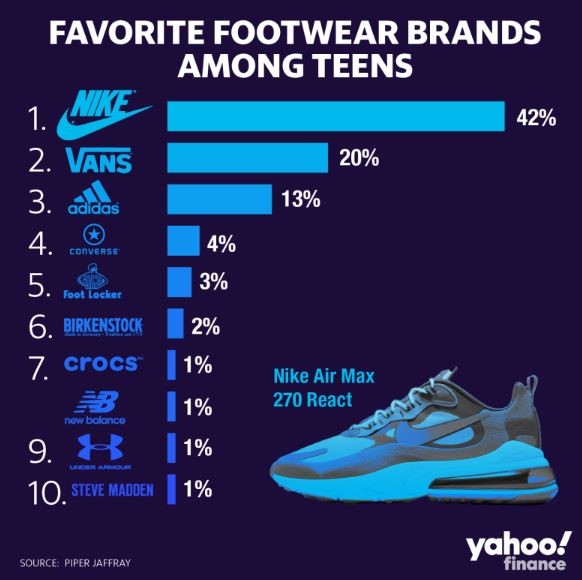
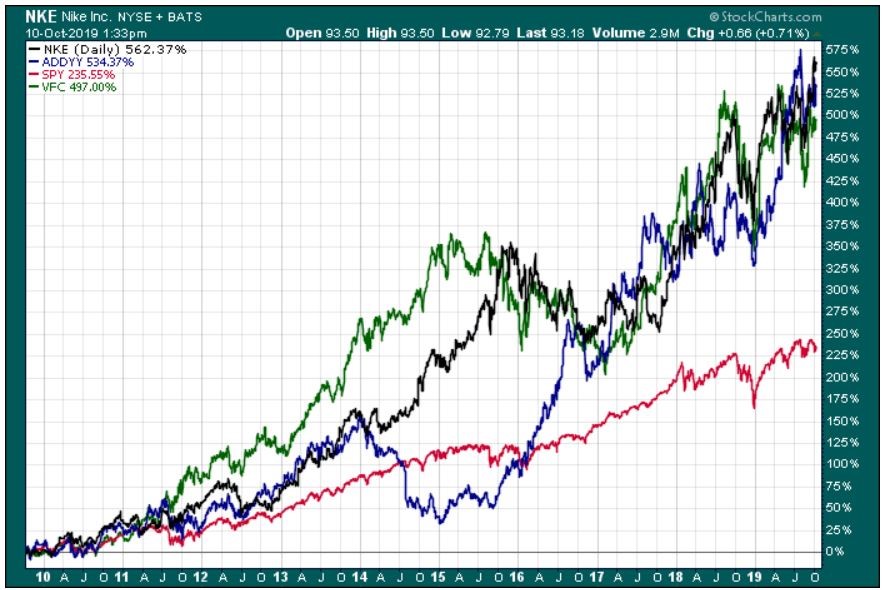
Nike was by far the most favored brand, followed by Vans (owned by VF Corp) and Adidas coming in third. These three brands dominate the category and have for years. Incidentally, these brands are very popular with the Millennials and Gen-X as well. They have strong brand relevancy, solid operating metrics, and high brand love ratings. As you might imagine, these stocks have significantly outperformed the S&P 500 over the last 10 years.
- VF Corp is the green line and returned 497% for the last 10 years
- Adidas is the blue line and returned 534% for the last 10 years
- The S&P 500 ETF, SPY is the red line and returned 235% for the last 10 years