

We are currently in the second longest bull market in history. In just a few short months, it is set to become the longest, even if we continue in this sideways range. The U.S. presidential election sparked a seemingly unshakeable rally during which the S&P 500 gained 36% (with dividends) in 15 months, and posted positive returns each of those months on a total return basis.
And then, suddenly, February brought the first market correction (defined as a decline of at least 10%) in two years. In the four months since, the market nearly recovered before retesting correction lows; despite continued volatility, we still have not recovered to January’s highs. The questions remain: are we in bear territory and is it time for investors to bail on equities?
Periods of market strength generally bring optimism and, after sustained rallies, complacency. Market pullbacks spark fear and confusion. The challenge for investors is determining how and when a pullback necessitates action as opposed to patience. Fear and emotion easily cloud decision making when faced with a perceived imminent threat of losing wealth and financial security. In trying to understand what type of market we are in (or are heading to) historical context is valuable.
A 36,000 foot view of past corrections and bear markets tells us an important story. Generally, the dynamics differ between corrections and bear markets. Drawdowns that happen quickly, such as the corrections of 2010, 2011, 2015, 2016 and this year, tend to be headline-driven as opposed to systemically-driven. An event or data point causes speculation, then fear, then selling, in turn triggering more fear and more selling. When the dust settles, the sun is still shining and cool heads prevail.
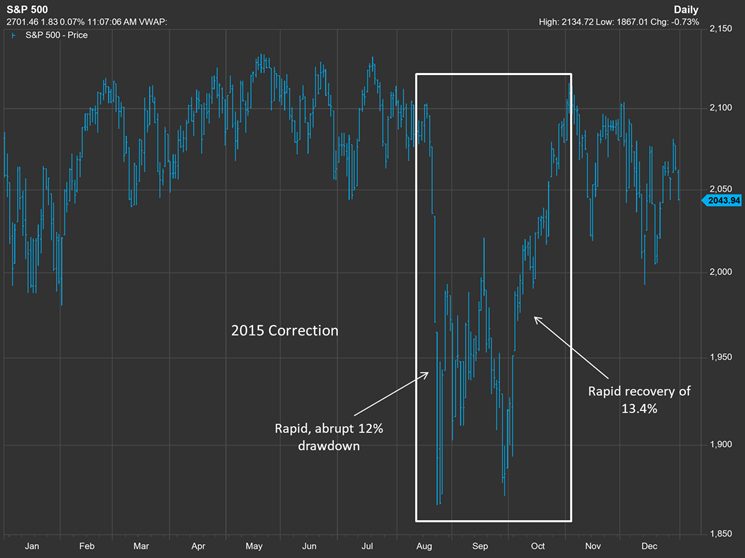
Chart source: FactSet
Even during bull markets, corrections are quite common. Since March 2009 (the start of the current bull market), there have been five double-digit corrections, including the one we are still in. There have been another 13 pullbacks in the 5-10% range. All the while, the S&P 500 has returned 395% (as of June 15, 2018), or 18.7% annually. The benefit of hindsight shows that investors were well-served by staying in the market over this entire period.
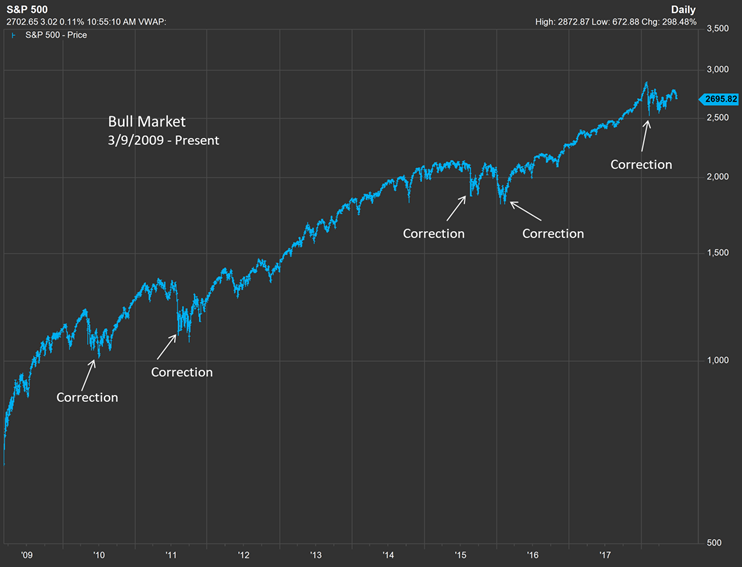
Chart source: FactSet
But how do we know if a 10% loss is “small”? How do we know it will recover, or that it will become the next 55% loss like 2008-09? While we can only know for certain in hindsight, we can use history as a guide to making decisions that are more likely to serve us better in the long run.
This past February, we experienced a market correction catapulted by a single data release that showed wages growing faster than expected. This prompted speculation that inflation was ramping up, and intense selling followed. Isolated, this incident might cause bear speculation, as similar selling pressure is characteristic of the more intense part of a bear market. However, a bear market tends to be preceded by a longer period of declines that rolls over slowly and more steadily. Instead of a long period of declines prior to February’s correction, we had a 15-month stretch giving us 36% gains.
Bear markets tend to be prompted by a more gradual unearthing of systemic concerns. When we think about the 2008 bear market, we typically think of the “crash” part – September and October of 2008, when the bottom fell out. Yet, before the crash, the market spent an entire year steadily declining toward the -20-22% mark. Many forget that the bear market started a full year earlier, because it was quieter, less noisy.
While not predictive by any means, the speed and intensity of a pullback can be indicative of true underlying market risk. The key to identifying such conditions more accurately is by implementing a disciplined, systematic measuring system to gauge these factors in an unemotional manner. Do not simply evaluate the here and now, unless tomorrow is your investment horizon. A long-term focus is essential. The goal is to give yourself a better chance of staying on the gravy train until you know, with a high degree of confidence, that the ride may be over. Would you sell your house in the middle of a recession to avoid further depreciation?
Out of the ashes of the 2008 market crash came a proliferation of tactical investing strategies, which offer the general goal to minimize losses by rotating between asset classes more frequently or aggressively than the more traditional, strategic asset allocation approaches. Over the years, one commonality has prevailed among many tactical strategies: a short-term horizon and reactionary moves have led to whipsaw, the effect of getting out late and back in late. Often, knee-jerk reactions in fast, headline driven markets causes more harm than help, and as such many tactical strategies have failed to keep pace with the bull market, leaving investors disappointed with lackluster returns.
To avoid these mistakes, pay careful attention and be prudent about your moves in and out of equities. Sometimes missed gains hurt more than losses, like watching the train highball into the sunset without you.
The post Historical Market Patterns Show No Indication A Bear Market Is Imminent appeared first on Catalyst Tactical Allocation Fund Blog.