Important thesis: if the S&P 500 Index has generated an annualized return of roughly 8-10% over the long-term, leading companies serving important industries should, in theory, generate 300bps+ more over long periods of time. That’s what history has shown. Understanding this and investing for it offers investors a long-term edge. Importantly, underperforming years tend to be great buying opportunities so being a contrarian also offers an edge. Brands matter because consumer behavior is largely driven by brand loyalty. The higher the loyalty, the better the business. The better the business, generally the better the stock.
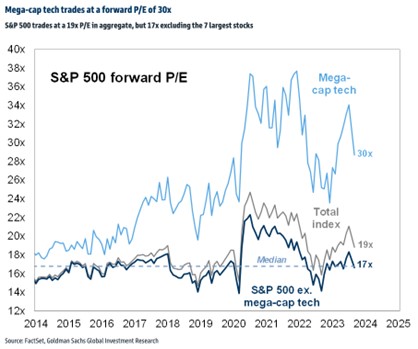
Chart of the Week: Valuations & headlines can be misleading.
- The magnificent Seven are some of the most innovative & best run businesses.
- Currently, the Magnificent Seven trade at ~30x earnings but that’s only part of the story.
- High quality businesses with visionary management teams, with strong balance sheets should trade at a premium to the market.
- These businesses are taking share and investing for growth while others retrench.
- Magnificent businesses tend to outperform the market.
- When great businesses keep innovating and delighting customers, they are worth the premium price.
- Apple, Microsoft, Amazon, Tesla, Nvidia, Google, Meta are truly exceptional businesses.
- The rest of the market is trading at attractive multiples, at ~14-17x pe.
- Consumers continue to be very stingy with their dollars. Stock valuations are down.
- Roughly 2/3 of the consumer stock universe is now in “attractive value” territory.
- We are finding more attractive brands to own today than ever before.

Some of Our Favorite Brands Now:
- Live Nation (LYV): the largest live events & ticketing brand in the world.
- Continued tremendous global demand for live events and experiences.
- No signs of slowing demand even after two strong years post-Covid.
- Experiences > goods spending continues to be consumers’ preferences.
- Relative to other experiences, live events continue to be an affordable luxury.
- Sold 128m tickets through August & see >135m tickets sold in 2024.
- Regional & amphitheater venues should drive growth in 2024 over large areas.
- What drives continued growth: the globalization of artist brands via streaming.
- Live events have historically been recession resistant.
- Multiple ways to monetize events: sponsorships, on-site spend, ticketing, venue.
- The stock is on sale, is cheap relative to itself, & opportunities have never been better (Goldman Charts).
- Uber (Uber): the largest ride sharing & logistics brand in the world.
- Uber has finally right sized its bloated operations & divested non-core units.
- Building, best-in-class verticals that are focused on a single leading platform.
- $1.1B in annual free-cash flow and growing over time.
- Top line now growing well with margins expanding as market share expands.
- Ad business growing fast, currently on a $650m annual run-rate. Goal >$1B.
- Consumer trends remain healthy, demand across Mobility & Delivery robust.
- Given attractive FCF profile going forward, buybacks are the likely outcome.
- In our opinion, it’s only a matter of time before Uber is added to the S&P 500.

Disclosure:
The above report is a hypothetical illustration of the benefits of using a 3-pronged approach to portfolio management. The data is for illustrative purposes only and hindsight is a key driver of the analysis. The illustration is simply meant to highlight the potential value of building a consumption focused core portfolio using leading companies (brands) as the proxy investment for the consumption theme. This information was produced by Accuvest and the opinions expressed are those of the author as of the date of writing and are subject to change. Any research is based on the author’s proprietary research and analysis of global markets and investing. The information and/or analysis presented have been compiled or arrived at from sources believed to be reliable, however the author does not make any representation as their accuracy or completeness and does not accept liability for any loss arising from the use hereof. Some internally generated information may be considered theoretical in nature and is subject to inherent limitations associated therein. There are no material changes to the conditions, objectives or investment strategies of the model portfolios for the period portrayed. Any sectors or allocations referenced may or may not be represented in portfolios managed by the author, and do not represent all of the securities purchased, sold or recommended for client accounts. The reader should not assume that any investments in sectors and markets identified or described were or will be profitable. Investing entails risks, including possible loss of principal. The use of tools cannot guarantee performance. The charts depicted within this presentation are for illustrative purposes only and are not indicative of future performance. Past performance is no guarantee of future results.

