


This week on the Trading Zone, we explore the complexities of volatility as we approach the upcoming presidential election and also the massive rebalancing in the tech center following the Nvidia hit this past week. To first understand where the market is headed, it is crucial to recognize and understand where inflation is headed.
Taking a look at the PCE (Personal Consumption Expenditures), we have critical indications of how much the market will move in the coming months. Current PCE measures show minimal to no monthly changes. Currently, Sweden, Mexico set rates; France, Italy and Canada’s inflation are due.
Charts & Their Implications on the Market
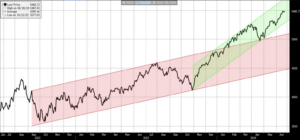
SPX 2 Year Trends
The S&P 500 has been on a tear lately, and investors are rightfully excited. Since October 2022, the index has been steadily climbing in a well-defined uptrend (represented by the red channel). This positive momentum has been a welcome sight after any previous volatility.
But here’s what’s truly impressive: since October 2023, the S&P 500 has shifted gears and accelerated even further. This surge is visualized by the new, steeper green channel. The previous red channel has now become a key support level, acting as a floor that the market bounces off of during any pullbacks.
Bullish Signs Ahead
This pattern is a strong indicator of continued bullish sentiment. As long as the S&P 500 remains above the green channel, the uptrend is likely to persist. This doesn’t mean there won’t be temporary dips – that’s a normal part of any market cycle. However, as long as the price action stays within the confines of the green channel, the overall trend remains positive.
Keeping a Watchful Eye
Of course, no trend lasts forever. We’ll be closely monitoring the situation, with a keen eye on any potential breaks below the green channel. A breach of this support level could signal a shift in momentum and a possible pullback.
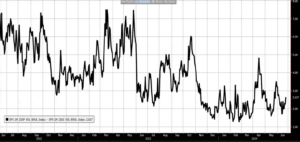
Skew 2 Year
Skew is catching a bid. A sign volatility is on the rise. Tracking the skew is a key contrarian indicator which gives us cues as to when volatility is shifting. Currently the trend is positive for volatility with no clear contrarian signal of any shift in either direction.
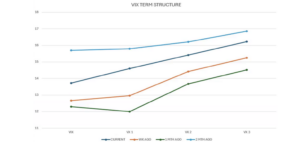
VIX Futures Curve
As we get closer to the election, the VIX is going higher. More people are worried about volatility come the election. Most expensive future is October as people expect the most volatility there.
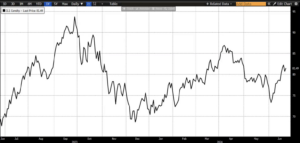
OIL 1 Year
Oil is coming back–in the middle of its big range. A new relative high above 86 or a new relative low below 74 would be big news. In the meantime, this channel is getting tighter and is looking ready to break.
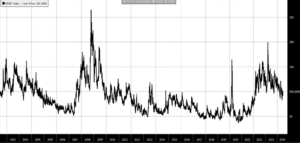
MOVE INDEX
Bond Chill Signals Stock Market Thrill: Unveiling the MOVE Index
For the past three years, bond investors have been living on a rollercoaster. The MOVE index, a key gauge of volatility in the U.S. Treasury market, has been hovering at unusually high levels, reflecting heightened uncertainty about the future. But here comes some long-awaited good news: the MOVE index is finally starting to cool down!
Today, the MOVE index dipped to 94, a significant decline from its elevated levels of the past few years. This downward trend is a welcome sign, potentially indicating that economic and inflation concerns, the usual culprits behind a high MOVE index, are finally easing.
Why Does This Matter for Stocks?
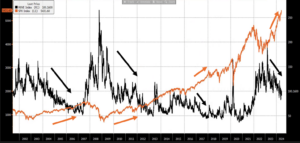
The relationship between the MOVE index and the stock market is an interesting one. Historically, a calmer MOVE index (meaning lower volatility in the bond market) coincides with a rising stock market. Why? Let’s break it down:
- Lower Risk, Higher Appetite: When investors are worried about the economy or inflation, the MOVE index is on the rise, this reflects this increased volatility in the bond market.
- Shifting Gears: As the MOVE index falls and bond market volatility subsides, it suggests that economic and inflation concerns are diminishing. This newfound confidence can lead investors to shift their focus back to stocks, seeking higher potential returns compared to bonds.
A Look Back Confirms the Trend
If you take a historical look at the chart, you’ll see a fascinating pattern. Periods of decline in the MOVE index often coincide with periods of growth in the stock market. This suggests that the current dip in the MOVE index could be a positive sign for equities.
MOVE INDEX and SPX
Tech Rebalance. NVDA and AAPL Go NUTS!
Last week was a rollercoaster ride for tech investors, with Apple (AAPL) and Nvidia (NVDA) taking center stage.
AAPL Takes Off on WWDC Wings
The week kicked off with AAPL hitting all-time highs after their Worldwide Developers Conference (WWDC). Investors were buzzing about the company’s announcement of groundbreaking new AI features, fueling excitement for the upcoming iPhone release. This positive sentiment sent the stock price skyrocketing.
NVDA Flies High on Stock Split Momentum
Meanwhile, NVDA continued its post-stock split momentum, briefly surpassing the $140 mark. The split had made the stock more accessible to individual investors, contributing to the surge in demand.
XLK Rebalances the Scales
But amidst the individual stock news, a hidden force was at play. The week culminated with a major rebalancing by the behemoth tech ETF, XLK. This $80 billion fund, known for holding some of the biggest names in technology, needed to adjust its holdings due to AAPL’s significant weight within the portfolio.
AAPL Feels the Trim, NVDA Gets a Lift
The rebalancing involved XLK paring back its AAPL holdings by over $10 billion. This significant reduction in demand put downward pressure on AAPL’s stock price, causing a pullback by week’s end. Conversely, NVDA benefited from the rebalancing, as the fund increased its weighting in the company.
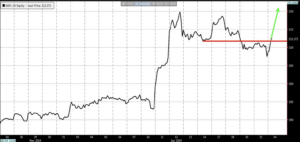
AAPL 1 M
People selling NVIDIA are buying APPLE back. Expect an increase in Apple because selling pressure has subsided.
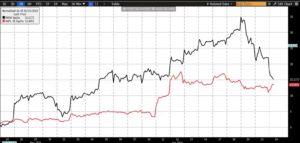
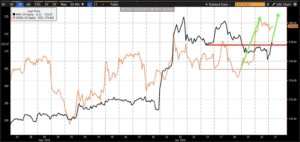
AAPL GOOGL 1 M
Expect Apple to run the same pattern as Google. New optimism with the AI excitement to shift to Apple, indicating huge upside and a possible rally for Apple. Apple is poised to play catch up to where Google has moved and the trend is to push Apple to all time highs.
Join us on the Equity Armor Channel as we navigate these market mysteries and equip you with the knowledge to navigate the ever-evolving financial landscape. Let’s explore the markets together and understand the forces shaping the market’s current course.