

“When you sit down with your portfolio management team, and the first comment made is ‘this is nuts,’ it’s probably time to think about your overall portfolio risk. On Friday, that was how the investment committee both started and ended – ‘this is nuts.’” – January 11th, 2020.
I revisited that original post a couple of weeks ago as the market approached its 5000 psychological milestone. Since then, the entire market has surged higher following last week’s earnings report from Nvidia (NVDA). The reason I say “this is nuts” is the assumption that all companies were going to grow earnings and revenue at Nvidia’s rate.
Even one of the “always bullish” media outlets took notice, which is notable.
“In a normal functioning market, Nvidia doing amazingly is bad news for competitors such as AMD and Intel. Nvidia is selling more of its chips, meaning fewer sales opportunities for rivals. Shouldn’t their stocks drop? Just because Meta owns and uses some new Nvidia chips, how is that going to positively impact its earnings and cash flow over the next four quarters? Will it at all?
The point is that investors are acting irrationally as Nvidia serves up eye-popping financial figures and the hype machine descends on social media. It makes sense until it doesn’t, and that is classic bubble action.” – Yahoo Finance
As Brian Sozzi notes in his article, we may be at the “this is nuts” stage of market exuberance. Such usually coincides with Wall Street analysts stretching to “justify” why paying premiums for companies is “worth it.”
We Can’t All Be Winners
Of course, that is the quintessential underpinning for a market that has reached the “this is nuts” stage. There is little doubt about Nvidia’s earnings and revenue growth rates. However, to maintain that growth pace indefinitely, particularly at 32x price-to-sales, means others like AMD and Intel must lose market share.
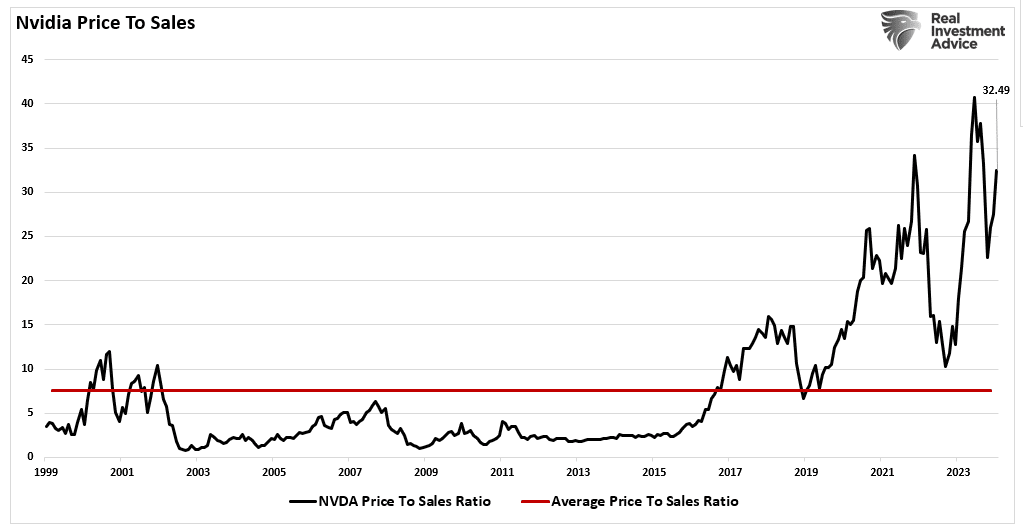
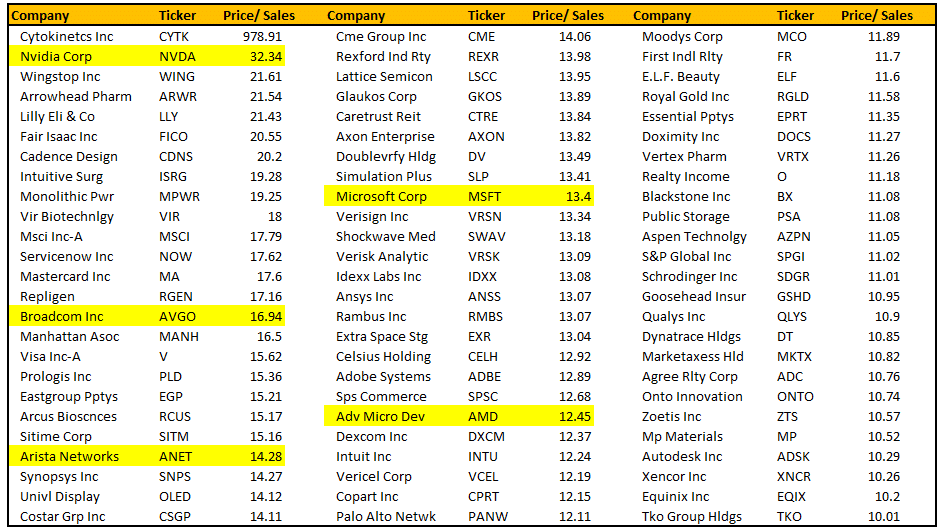
However, as shown, numerous companies in the S&P 1500 alone are trading well above 10x price-to-sales. (If you don’t understand why 10x price-to-sales is essential, read this.) Many companies having nothing to do with Nvidia or artificial intelligence, like Wingstop, trade at almost 22x price-to-sales.
Again, if you don’t understand why “this is nuts,” read the linked article above.
However, in the short term, this doesn’t mean the market can’t keep increasing those premiums even further. As Brian concluded in his article:
“Nothing says ‘investing bubble’ like unbridled confidence. It’s that feeling that whatever stock you buy — at whatever price and at whatever time — will only go up forever. This makes you feel like an investing genius and inclined to take on more risk.”
Looking at some current internals tells us that Brian may be correct.
“This Is Nuts” Type Of Exuberance
In momentum-driven markets, exuberance and greed can take speculative actions to increasingly further extremes. As markets continue to ratchet new all-time highs, the media drives additional hype by producing commentary like the following.
“Going back to 1954, markets are always higher one year later – the only exception was 2007.”
That is a correct statement. When markets hit all-time highs, they are usually higher 12 months later due to the underlying momentum of the market. But therein lies the rub: what happened next? The table below from Warren Pies tells the tale.
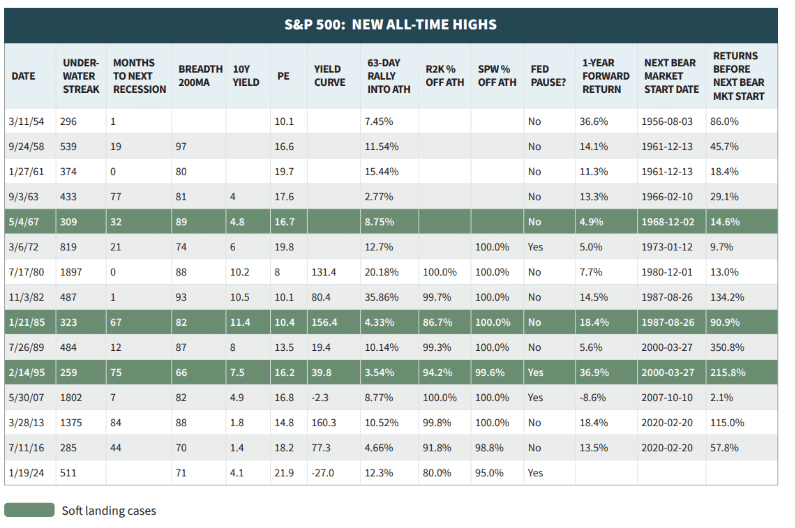
As shown, markets were higher 12 months after new highs were made. However, a lot of money was lost during the next bear market or correction. Except for only four periods, those bear markets occurred within the next 24 to 48 months. Most gains from the previous highs were lost in the subsequent downturn.
Unsurprisingly, investing in the market is not a “risk-free” adventure. While there are many opportunities to make money, there is also a history of wealth devastation. Therefore, understanding the environment you are investing in can help avoid potential capital destruction.
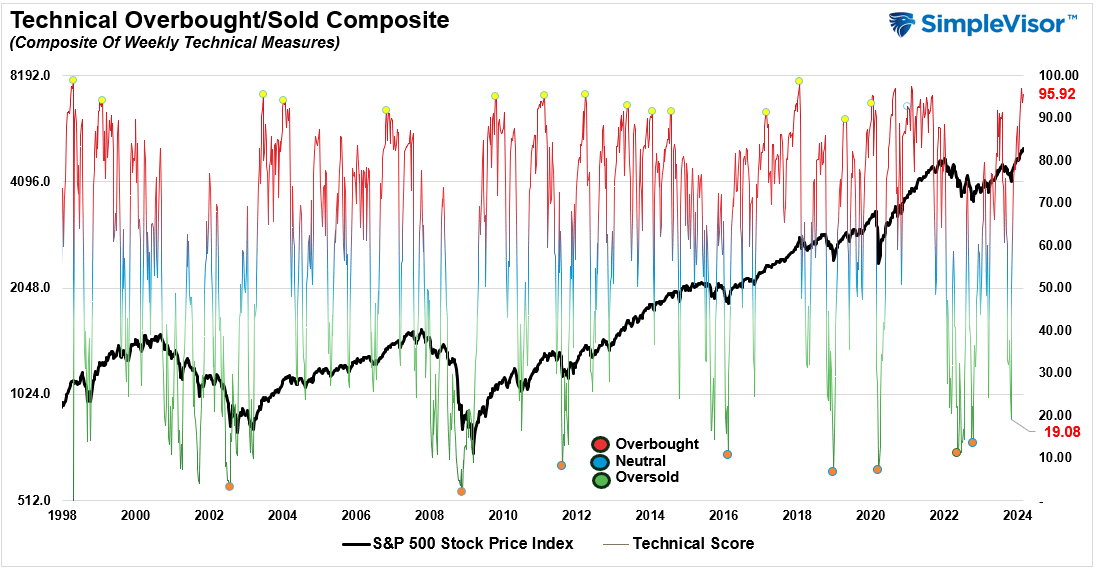
From a technical perspective, markets are exceedingly overbought as investors have rushed back into equities following the correction in 2022. The composite index below comprises nine indicators measured using weekly data. That index is now at levels that have denoted short-term market peaks.
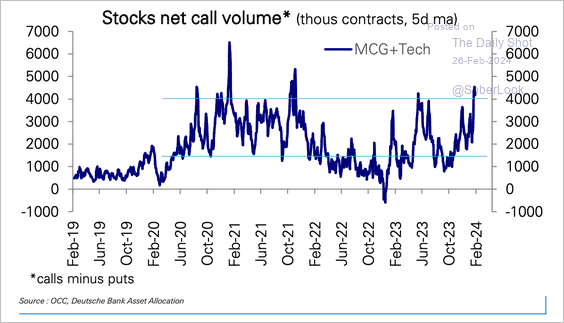
Unsurprisingly, speculative money is chasing the Mega-cap growth and technology stocks. The volume of call options on those stocks is at levels that have previously preceded more significant corrections.
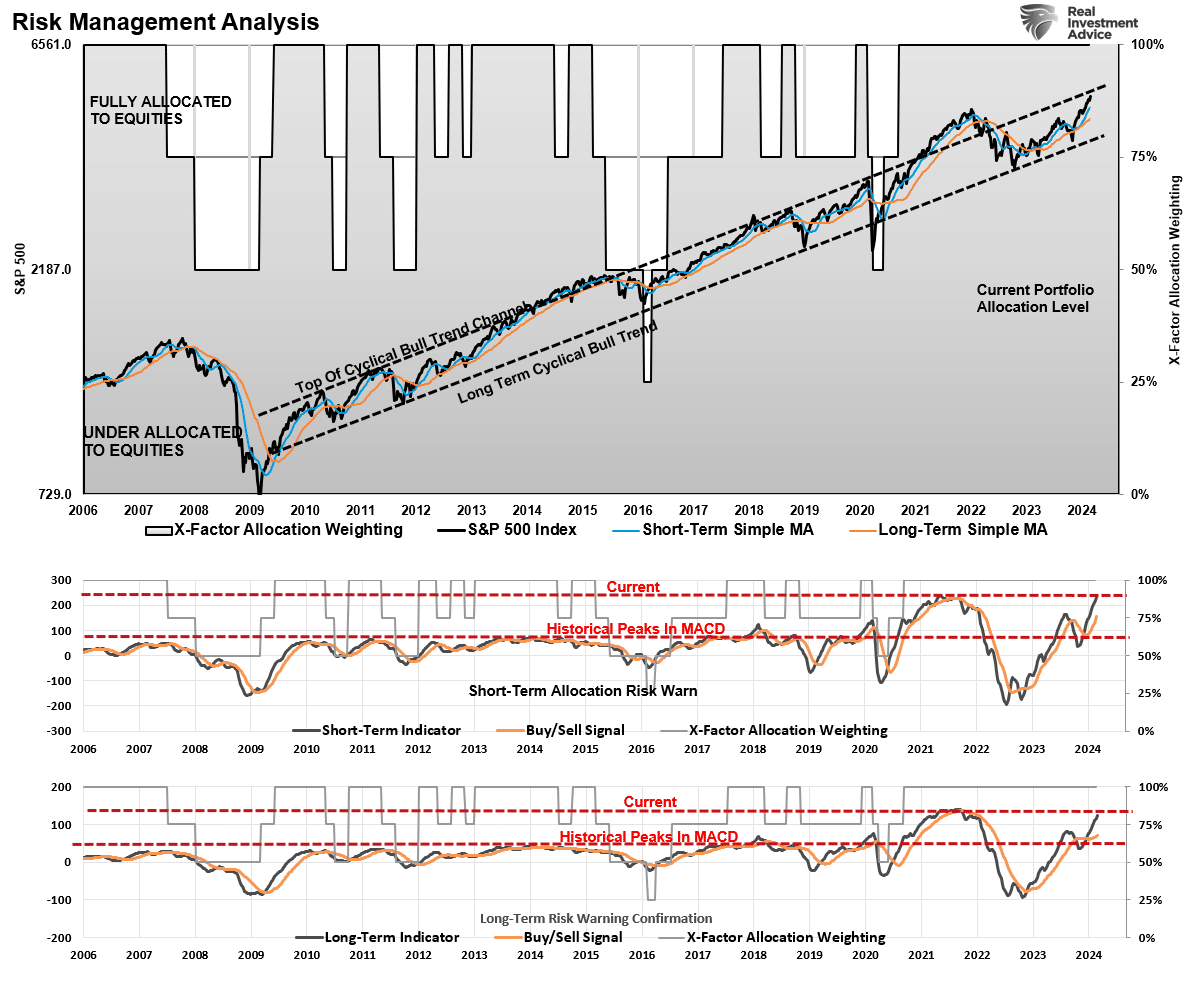
Another way to view the current momentum-driven advance in the market is by measuring the divergence between short and long-term moving averages. Given that moving averages smooth price changes over given periods, the divergences should not deviate significantly from each other over more extended periods. However, as shown below, that changed dramatically following the stimulus-fueled surge in the markets post-pandemic. Currently, the deviation between the weekly moving averages is at levels only previously seen when the Government sent checks to households, overnight lending rates were zero, and the Fed bought $120 billion monthly in bonds. Yet, none of that is happening currently.
Unsurprisingly, with the surge in market prices, investor confidence has surged along with their allocation to equities. The most recent Schwab Survey of bullish sentiment suggests the same.
“More than half of traders have a bullish outlook for the first quarter – the highest level of bullishness since 2021“
Yes, quite simply, “This is nuts.”
Market Measures Advise Caution
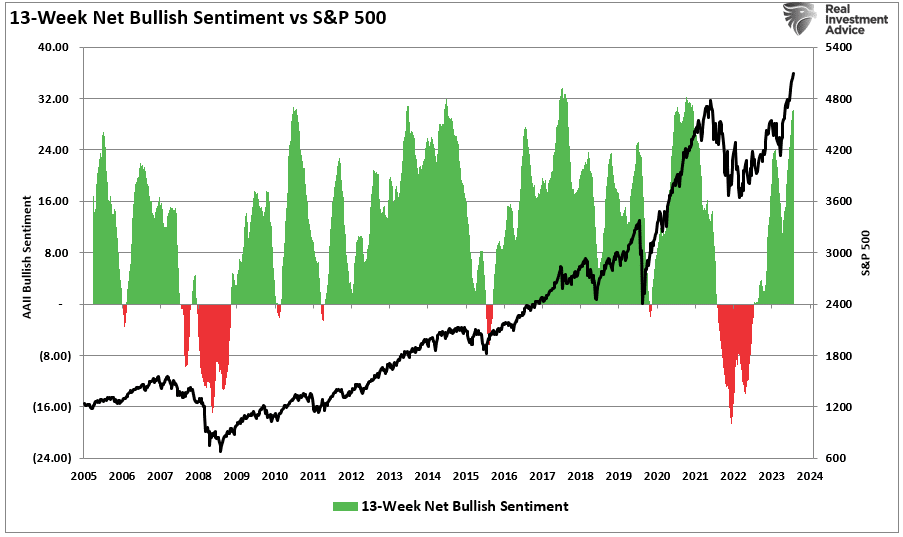
In the short term, over the next 12 months, the market will indeed likely finish the year higher than where it started. That is what the majority of analysis tells us. However, that doesn’t mean that stocks can’t, and won’t, suffer a rather significant correction along the way. The chart below shows retail and professional traders’ 13-week average of net bullish sentiment. You will notice that high sentiment readings often precede market corrections while eventually rising to higher levels.
For example, the last time bullish sentiment was this extreme was in late 2021. Even though the market eventually rallied to all-time highs, it was 2-years before investors got back to even.
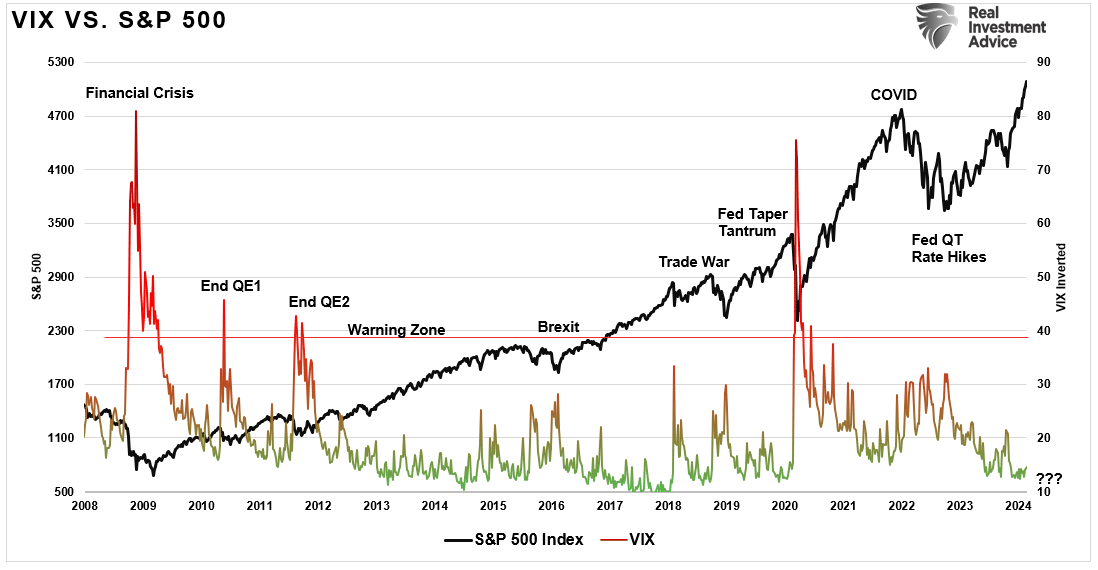
Furthermore, the compression of volatility remains a critical near-term concern. While low levels of volatility have become increasingly common since the financial crisis due to the suppression of interest rates and a flood of liquidity, the lack of volatility provides the “fuel” for a market correction.
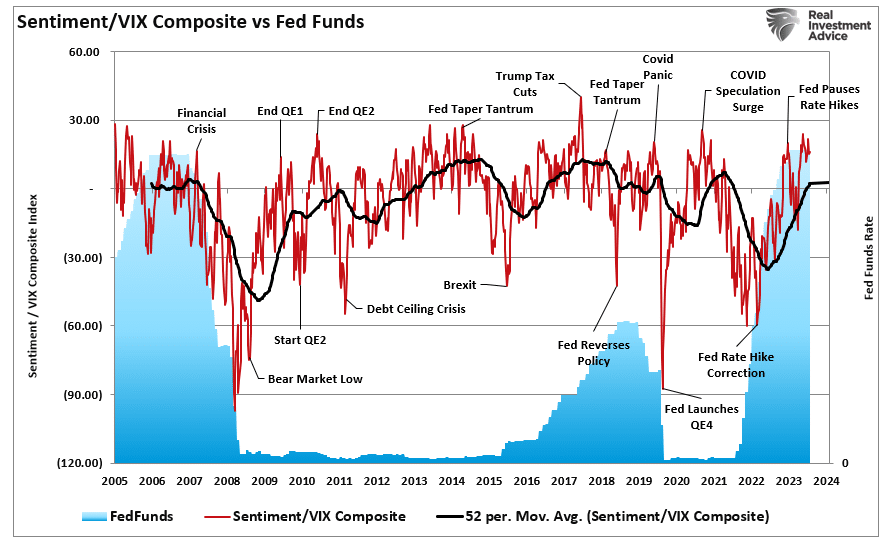
Combining excessive bullish sentiment and low volatility into a single indicator shows that previous levels were warnings to more bullish investors. Interestingly, Fed rate cuts cause excess sentiment to unwind. This is because rate cuts have historically coincided with financial events and recessions.
While none of this should be surprising, given the current market momentum and bullish psychology, the over-confidence of investors in their decision-making has always had less than desirable outcomes.
No. The markets likely will not crash tomorrow or in the next few months. However, sentiment has reached the “this is nuts” stage. For us, as portfolio managers, such has always been an excellent time to start laying the groundwork to protect our gains.
“Lean on your investing experience and all its wrinkles.” – Brian Sozzi
The post This Is Nuts – An Entire Market Chasing One Stock appeared first on RIA.