The August CPI report that came out last Tuesday was the catalyst for a sharp market reversal. The headline number was a benign 0.1%, helped by falling gasoline prices. But the “core” number (ex food and energy) came in at 0.6%.
There were several factors, but chief among them because of its high weighting was shelter at 0.7%. which has a 32.3% weighting in the CPI. Food is 13.5% energy is 8.8%. When these two are removed to create the core figure, shelter’s weighting rises to 39.8%.
Within the core CPI number, Shelter is made up of Rent (9.3%) and Owners’ Equivalent Rent (OER, 30.5%), on which we have written before (see Why You Can’t Trust Reported Inflation Numbers). Two thirds of American households own their home. But the economists at the Bureau of Labor Statistics (BLS) want to separate out the service that a home provides (shelter) from its value as an asset.
To estimate OER, BLS statisticians survey homeowners to ask what they think they could rent their home for in the current market. The huge problem with this approach is that few of us give the matter much thought. Homeowners generally know what their home is worth, but you won’t hear cocktail chatter about how the imputed rent on one’s townhouse suddenly shot up.
Home ownership is the prevailing choice of shelter in America. Therefore, OER has a substantial weight in the BLS assessment of living costs, even though uniquely within the CPI it’s not based on cash transactions.
The shortcomings in OER are about to complicate monetary policy.
In theory, if home prices are rising this should cause rents, including the OER, to rise as asset owners seek to maintain their return on investment.
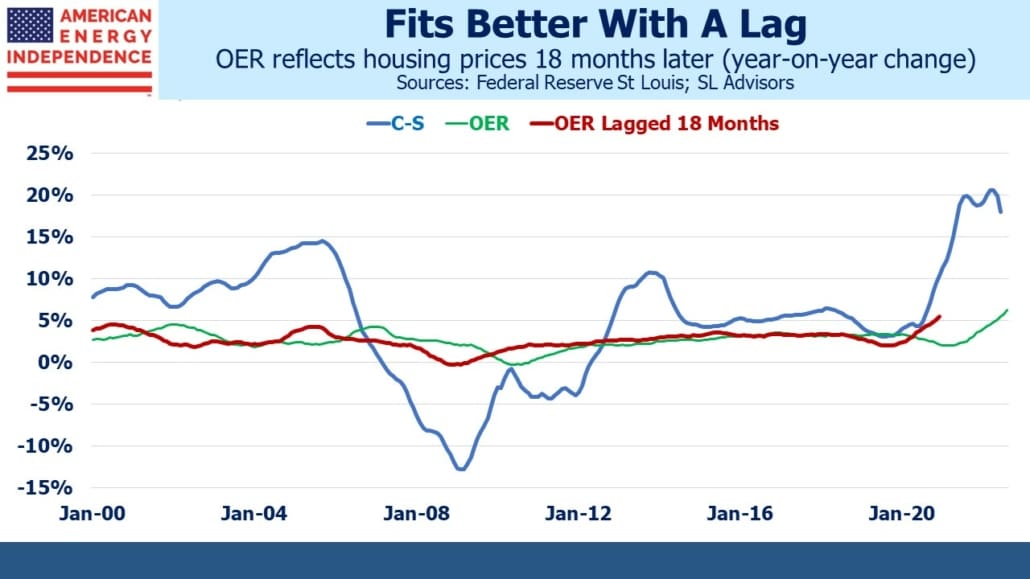
Everyone outside the BLS knows real estate has been hot. Home buyers have regularly been required to pay over the asking price to get a deal done. The S&P/Case-Shiller U.S. National Home Price Index (C-S) has reflected this, increasing year-on-year at 18% as of June (the most recent figure available).
There are signs that the tight real estate market is moderating. The C-S index was rising at 20.6% in March and April. By contrast, OER is now rising, although as the long-term chart shows it fluctuates less than home prices.
But what’s really interesting is that OER is a lagging indicator. From 2000-2020 one year returns on C-S and OER have a correlation of only 0.35. Lagging OER improves the fit, and it turns out the 18 month lagged OER has a correlation of 0.75 with C-S.
The reason is likely that home owners are slow to convert changes in home prices into revised OER, because OER doesn’t affect them. Nobody pays OER. It takes over a year of rising (falling) home prices to show up as an increase (decrease) in OER. Homeowners have a slow reaction function. Inconveniently for the BLS, most of us just don’t think much about renting out our home.
This highlights a significant weakness in how the Fed assesses inflation. The rise in OER they’re observing today is a delayed reaction to the rapid house price appreciation the rest of us have been watching since the beginning of the pandemic in early 2020. Back then, the Fed didn’t see housing inflation because OER didn’t reflect it. Belatedly, it is showing up in the CPI.
Because the history of OER shows it reacts to home prices with a substantial lag, this means the shelter component of CPI is likely to look worse in the months ahead. Its large weight in the core CPI will keep this measure elevated. In this respect, it’s fair to say that the Fed is fighting the last war. In their public comments FOMC members have been very clear that they are looking for a sustained drop in inflation. It was higher than they thought six months ago, if not for the lagged feature of OER.
The fact that inflation expectations remain surprisingly moderate doesn’t appear to be an important consideration.
Core CPI is unlikely to fall substantially while OER is rising. Although the Fed prefers the Personal Consumption Expenditures deflator because of its dynamic category weightings, OER is used there too.
The inverted yield curve for interest rate futures makes more sense when you consider the slow reaction function of OER survey respondents. As long as the Fed uses this measure of housing, they’ll be relying on an echo of the past rather than real time. Based on the historical relationship between C-S and OER, the shelter component of the inflation statistics likely won’t peak for another year. It means the Fed is more likely to make the mistake of maintaining high rates for too long by relying on stale inflation data for shelter.
Only an economist could love OER. It’s about to play an outsized role in monetary policy for all the wrong reasons.
Please see important Legal Disclosures.
The post The Fed Is Misreading Housing Inflation appeared first on SL-Advisors.


