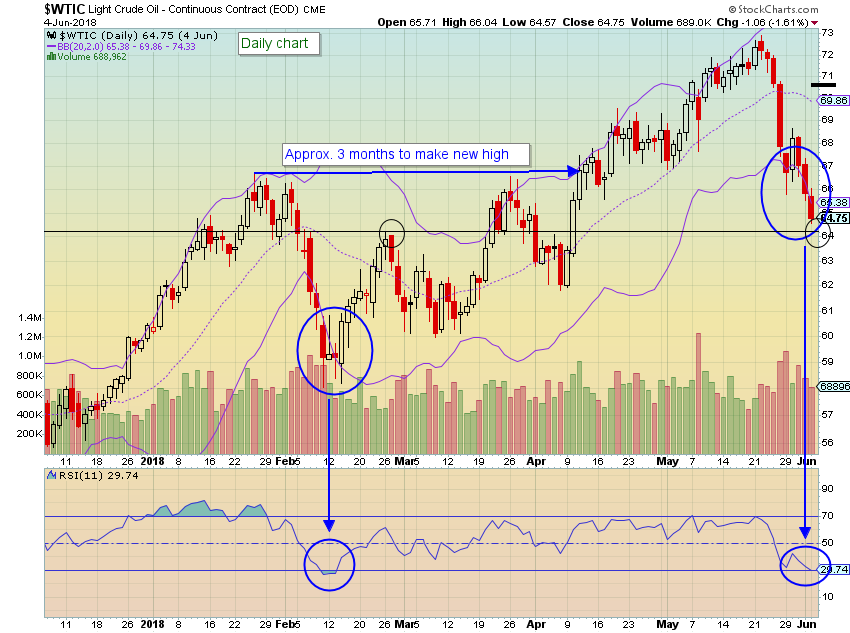
Oil has taken investors on quite the ride lately…especially if they were long. Since its high of $72.90 only nine trading days ago, crude has fallen nearly 12%. The low today was at a turning point that has been seen in the past.
Rewind to earlier this year when oil declined quickly during EOM Jan. – mid Feb., then rebounded. That decline was approx. 13%. A low only took a few days to form. Price dropped below the lower Bollinger Band and technicals became oversold (see chart). Once the bullish candlestick was seen, it only took 7 trading days to rebound 10% reaching $64.24, forming a new resistance/support level (before declining again).
Move earlier this year
- 13% drop (Break through BB & technicals oversold)
- Bullish candlestick started a 10% quick rebound to $64.24
- Another sharp drop
- Then congestion
Where we are now
- 10% drop (Break through BB & technicals oversold)
- Today’s low touched $64.22
- Currently trading at $65.40 (possibly the bullish candlestick for the start of a rebound?)

Today’s low ($64.22) met the Feb. resistance level ($64.24) and has rebounded. If we took a straight 10% rebound level off the low, then $70.64 would be the target.
Earlier this year, it took nearly 3 months to make new highs after the Feb. damage. Therefore, a quick new high I wouldn’t consider reasonable.
The post The Crude Chart is Looking Familiar appeared first on Catalyst Hedged Commodity Strategy Fund Blog.

