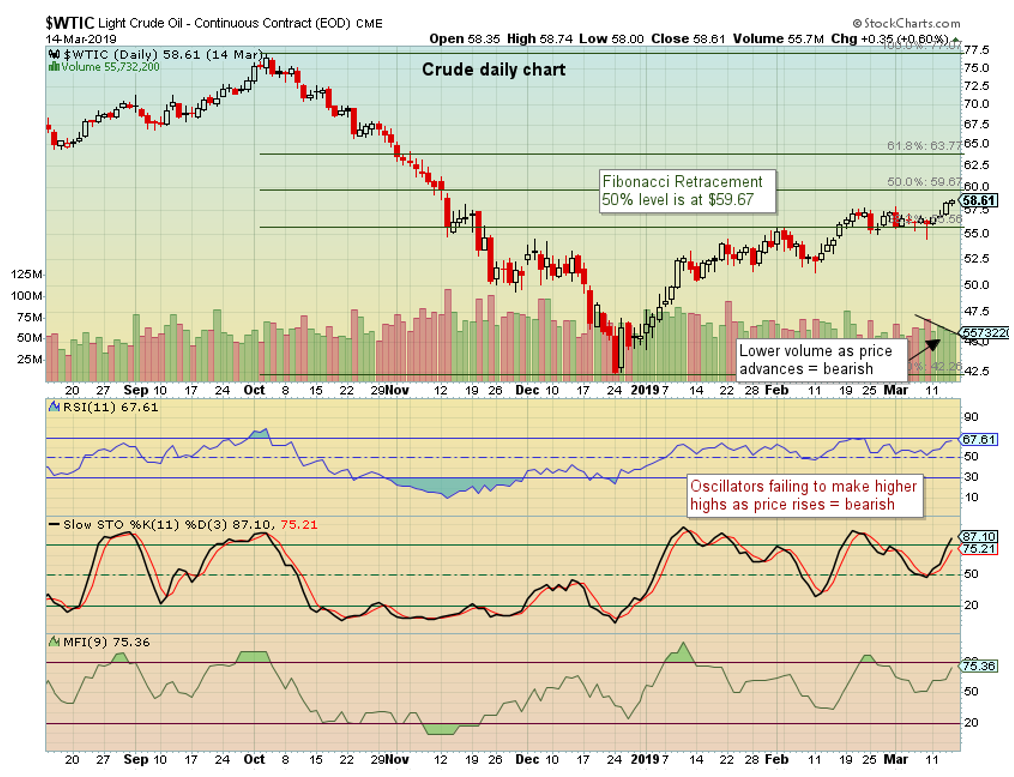
Oil has advanced 38% since the $42.36 low on Christmas Eve. The price of oil is trading at its highest level in 4 months. It was range bound from mid-February until just two days ago when price started making higher highs. In order for one to feel confident about a potential breakout, ideally the higher prices would be complimented with higher volume. This has not been the case.
Further observation of the crude oil continuous contract chart demonstrates other bearish factors as well.
- Fairly tight trading ranges, then a “breakout” candlestick with the higher closing price on the 13th, however the next candlestick resembles a “doji”, indicating indecision, rather than a follow through day.
- RSI (Relative Strength Index), Slow Stochastics and the Money Flow Index all have “lower highs” compared to the previous highs near Feb 20th. In other words, “Divergence” between price and oscillators.
- Drawing Fibonacci Retracement levels from the October peak to the December low shows that the 50% retracement level is at $59.67. This $1 dollar higher from the current price can be viewed as a resistance level which could be a pivot point for oil.
- And again, the black line on the chart shows lower volume during this weeks’ price advance.

In other words, bulls beware.
The post Technical Charts Don’t Support Oil’s High Price Level appeared first on Catalyst Hedged Commodity Strategy Fund Blog.

