Even after crude oil’s reported reserves draw of over 10-million barrels (mb) reported when estimates were near 2 mb, the price of oil has still not been able to hold a substantial rally. Wednesday’s high was made shortly after the EIA’s inventories number was released, then crude edged lower throughout the day. There are cases on both sides of the markets; lack of supply and declining rig counts for the bulls and decreasing world demand estimates and potential recession for the bears. Technically, indicators have nearly flat lined at their mid-points, however, prices have been forming a “descending triangle” pattern.
Two charts to view:
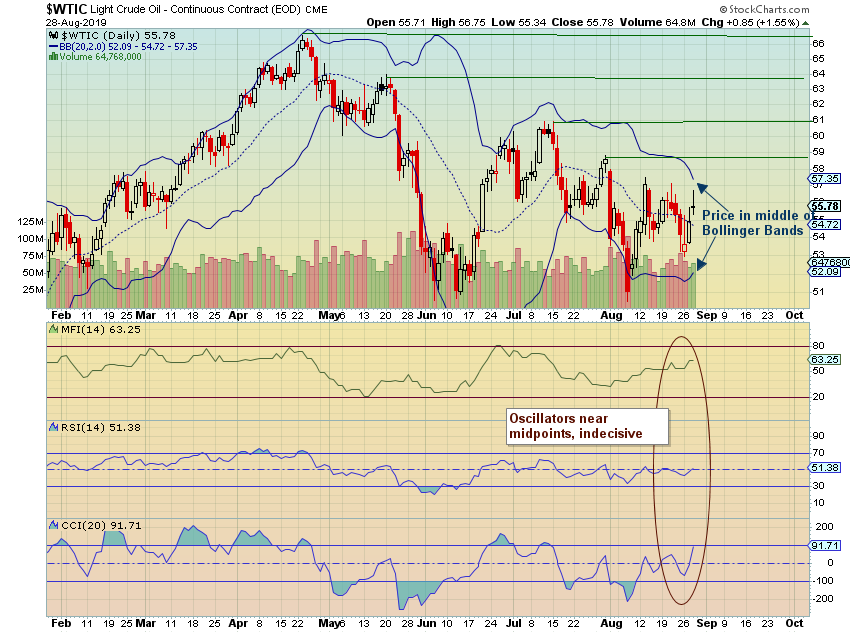
- The daily chart below shows that prices are near the mid-point of the Bollinger Bands with the range being $52.09 – 57.35. The green horizontal lines are resistance areas near $58.80, $60.90, $63.75, and 66.60. The oscillators below the chart are all near their mid-points, lacking decisive direction indications.


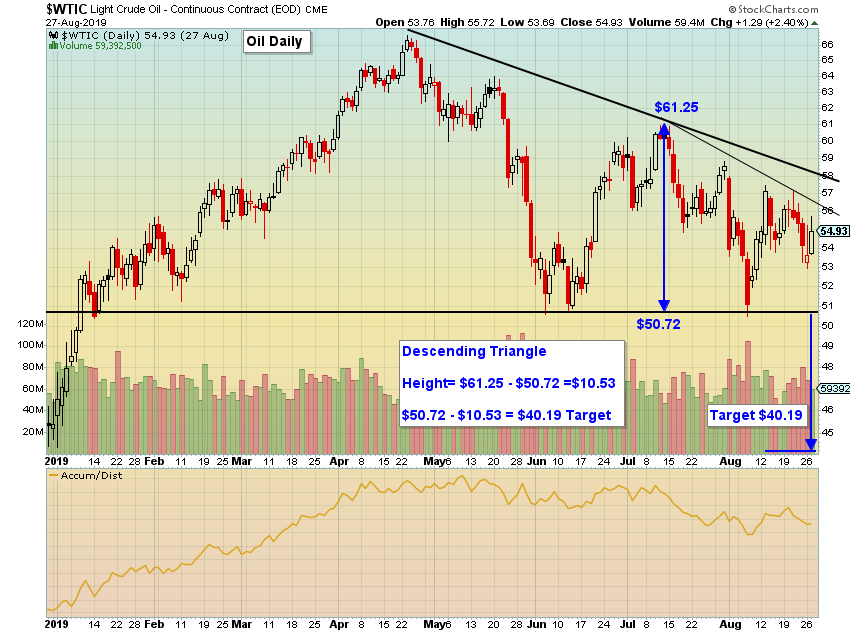
- This next chart is a little more interesting. It shows a descending triangle. Drawing the horizonal support line from the January, June, and August lows, and using a diagonal resistance line from the tops in April and July, a pattern comes into shape. This type of triangle is known as a bearish pattern and price targets can be estimated. The more touches of the trendlines within a triangle is preferred. For a price target, I’ve taken a mid-point difference from June high down to the horizontal trendline at $50.72 for a $10.52 height between the lines. If the lower support line is broken, an estimated price target would be $50.72 -$10.53 = $40.19. Prices rose very quickly earlier this year through the $40 range. Therefore, if prices can breach the horizontal line, little support is seen until the December 2018 low near $42. Some congestion is present near $45 also.

This post is not meant to be a price prediction, but rather just a math example on a descending triangle formation. The daily charts look fairly neutral technically. Patience and waiting for a breakout are also a trading strategy.


