A common concern of both existing and potential investors in energy infrastructure is the relatively high volatility of recent years. Many recall the “toll-model” of pipelines that was the basis of their appeal prior to 2014. As we have often written, the Shale Revolution broke the MLP model, as companies with very high payout ratios and hitherto minimal growth projects set about adding infrastructure. Oil in North Dakota, natural gas in Pennsylvania, and increasing volumes of West Texas crude oil required new investments (see It’s the Distributions, Stupid). The income-seeking investors originally attracted by high yields wound up in growth businesses that prioritized reducing leverage and funding projects over maintaining distributions.
Our theory is that this one-time alienation of the core investor base was highly disruptive and led to a period of heightened volatility. The shift in MLP business model from income generating to growth coincided with a sharp downturn in the energy sector. Investors worried about the profitability of upstream exploration and production companies showed similar concern over midstream. Even though EBITDA grew, and leverage fell for pipeline stocks during this period, the sector moved with the energy sector.
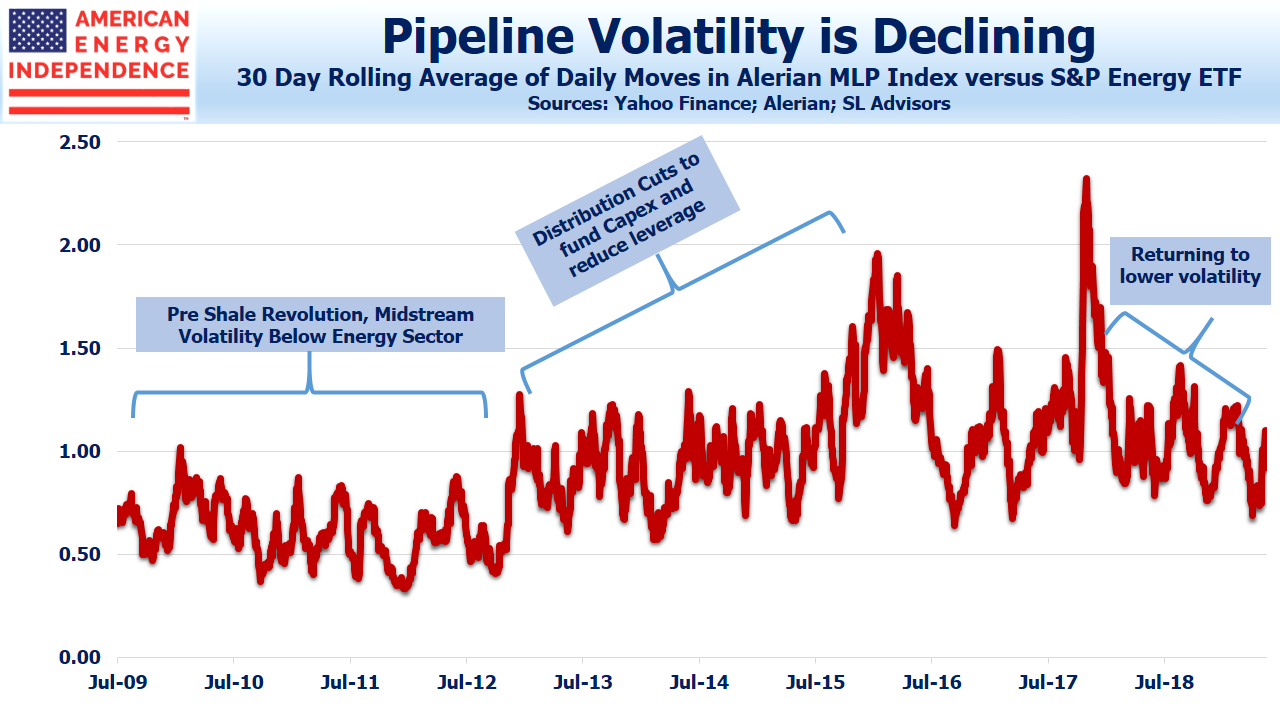
There are signs that this period of heightened volatility is ending. When energy markets bottomed in early 2016, the average daily percentage move of the Alerian MLP index reached almost 2.0X that of the S&P Energy Sector ETF (XLE). In late 2017, the ratio was briefly even higher. Since then, this relationship has improved dramatically in favor of these toll-like business models, falling by more than half and approaching the range that prevailed over seven years ago.
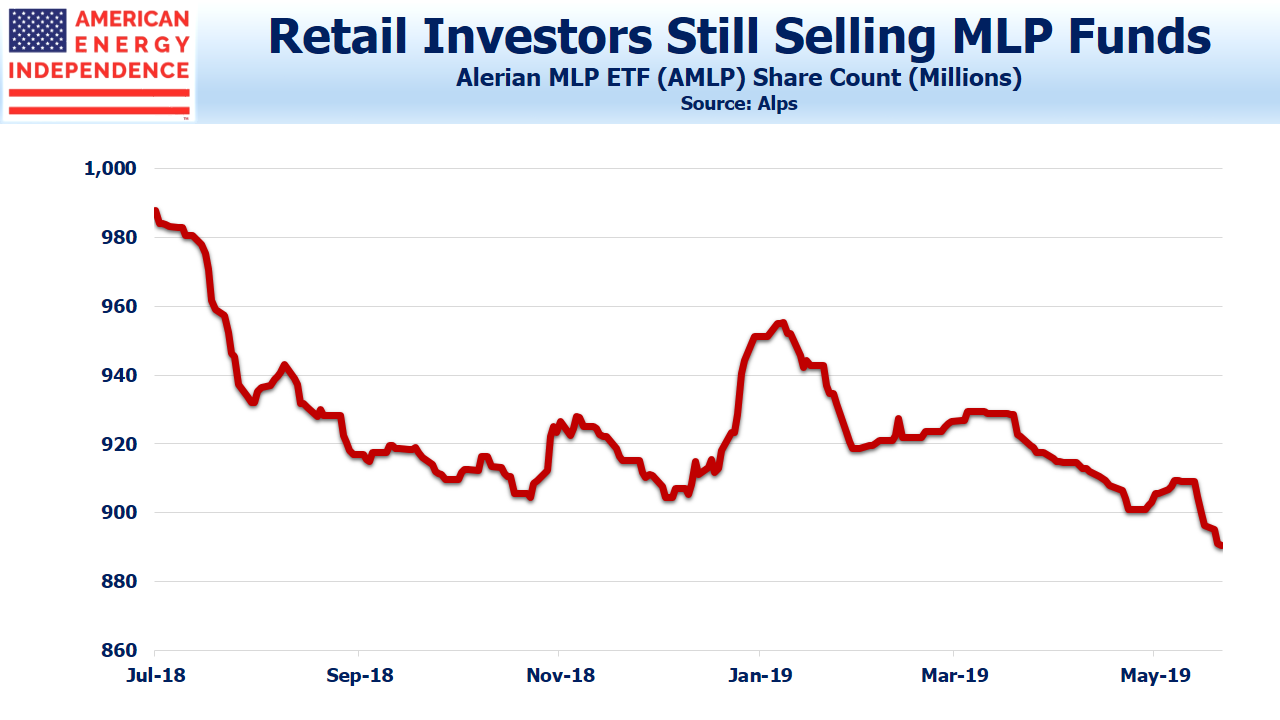
This shift is even more dramatic than it seems, because the Alerian MLP index has been steadily losing components, rendering it less diversified and therefore more prone to sharp moves than it would otherwise be. Investors continue to exit mutual funds and ETFs tied to MLPs, as shown by the steady drop in shares outstanding for the Alerian MLP ETF.
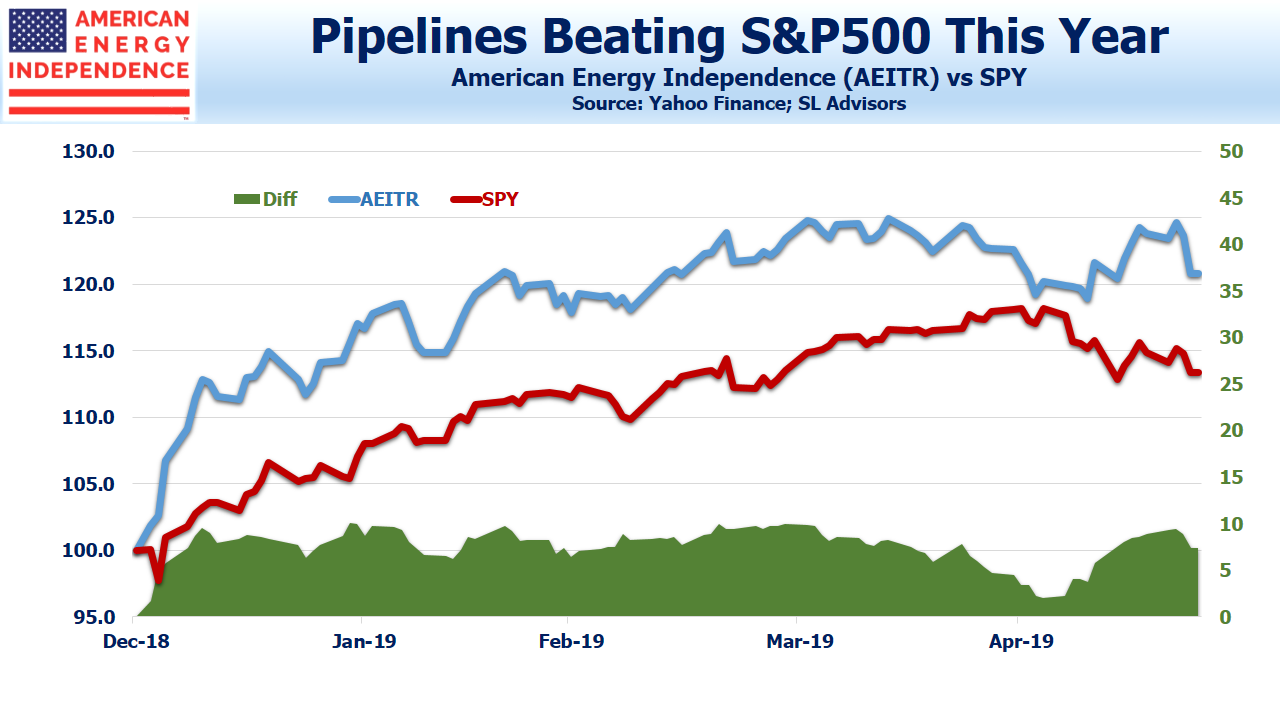
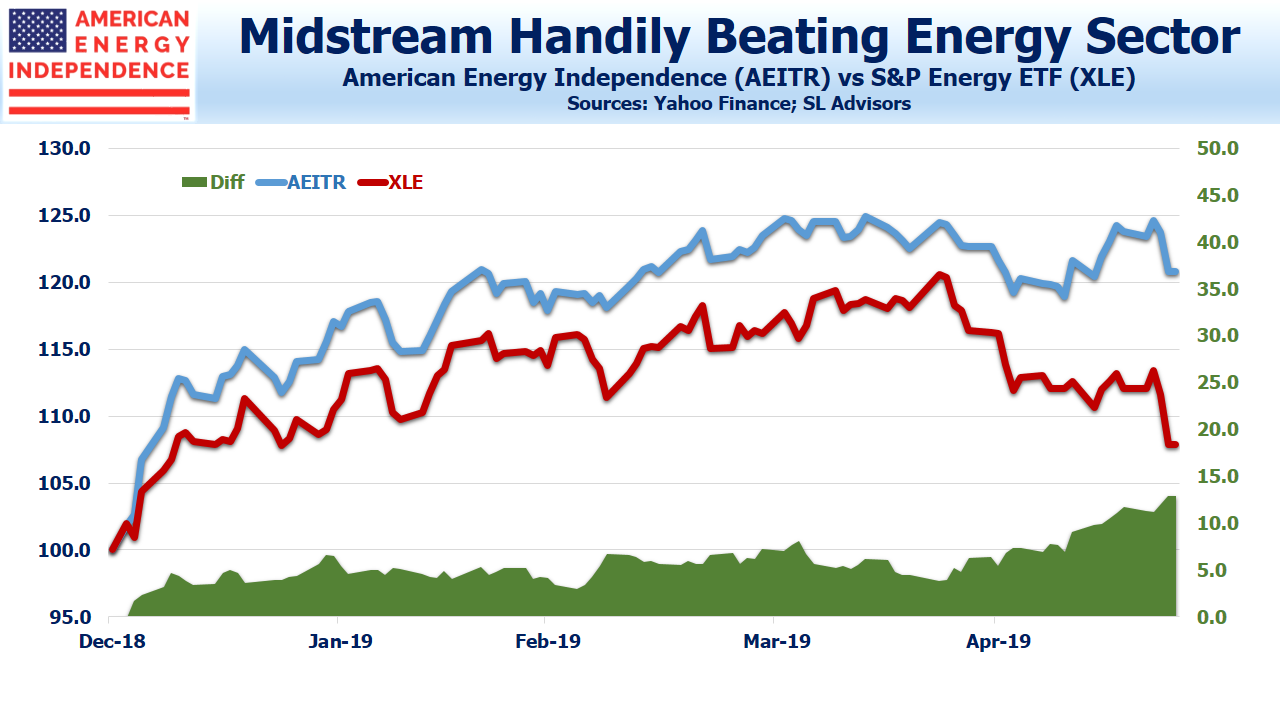
Nonetheless, relative performance for the sector more broadly defined to include corporations has held up very well. The American Energy Independence Index (80% corporations and 20% MLPs, more reflective of the sector’s market cap of 2/3 corporations) has retained its solid lead over the S&P 500 this year, and is substantially ahead of XLE, especially following last week’s market weakness.
A plausible explanation is that, although retail investors are shunning MLP-only funds, institutional buyers are beginning to commit capital to pipeline corporations. Converting from MLPs to corporations was driven by a desire for a broader, more stable investor base. Although there are fewer MLPs remaining, they include conservatively run companies such as Enterprise Products Partners (EPD) and Magellan Midstream (MMP). There are some good MLPs to own. However, some investors are starting to conclude that MLPs are too small a subset to command a sector allocation, and they’re more appropriate within a diversified portfolio that includes corporations.
The relative volatility of midstream infrastructure is reverting to the lower levels that prevailed before the Shale Revolution triggered the need for large infrastructure investments. Moreover, free cash flow is set to jump over the next three years (see The Coming Pipeline Cash Gusher). This will continue to attract generalist investors interested in attractively valued stocks with declining volatility.
The pipeline sector is showing good momentum to continue its outperformance, driven by institutional buyers gradually replacing the retail holders of narrow, MLP-only funds.
We are invested in EPD and MMP. We are short AMLP.


