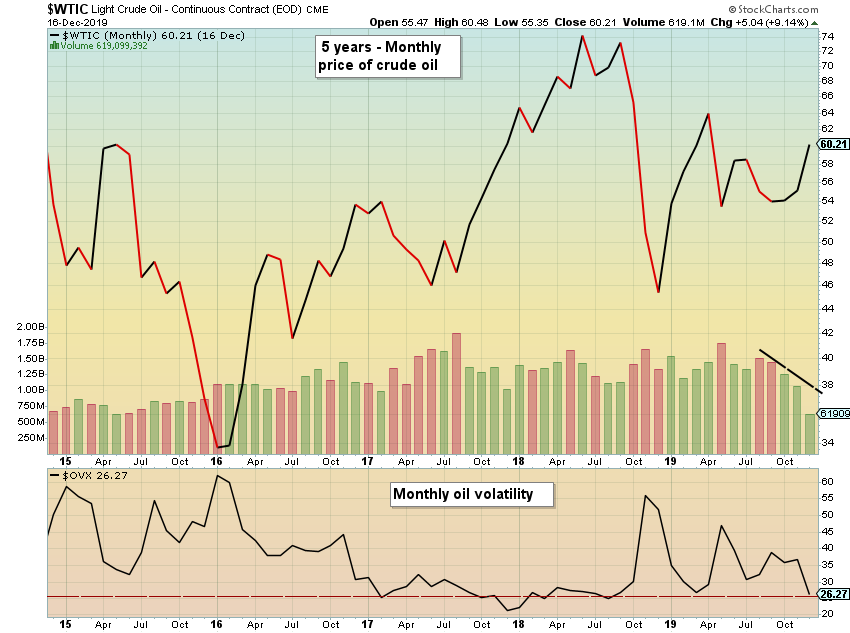
There has been a lot of news to absorb so far this month: the OPEC+ meeting is over; the trade deal news is out; and oil is still edging higher. On Tuesday, West Texas Intermediate (WTI) crude reached $61 per barrel, which amounted to over a 10% gain so far in December. The price advance drained volatility out of the oil market, with the $OVX oil volatility index dropping nearly 30% since the end of November. Oil volatility is now at a level not seen since spring of this year.
After such an advance on the daily charts, we wanted to review the weekly and monthly charts. The monthly chart above shows that oil volatility ($OVX) has been below the current level infrequently during the past five years, and oil volume has been declining since the end of summer.

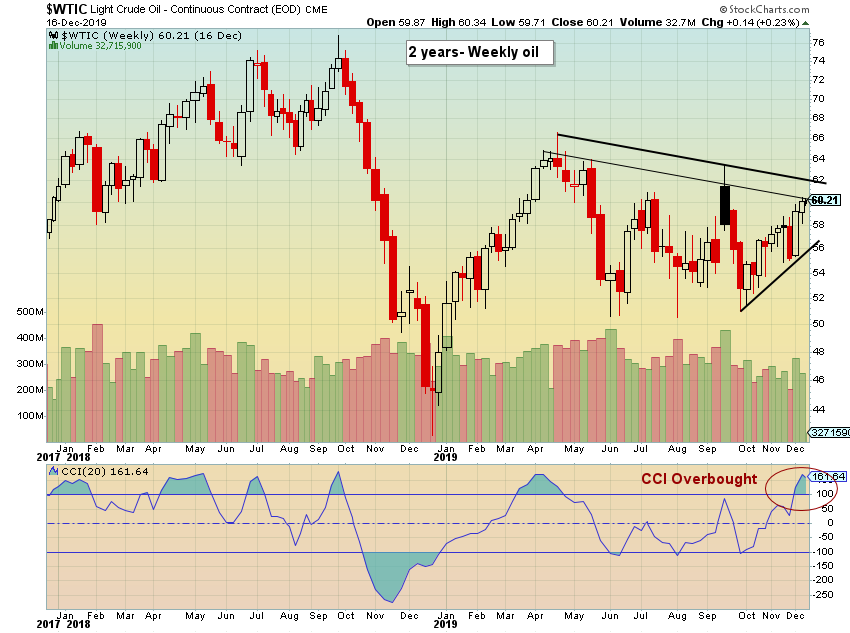
Below is the weekly chart over the past two years. Price is currently testing resistance levels, and the Commodity Channel Index (CCI) is in overbought territory.

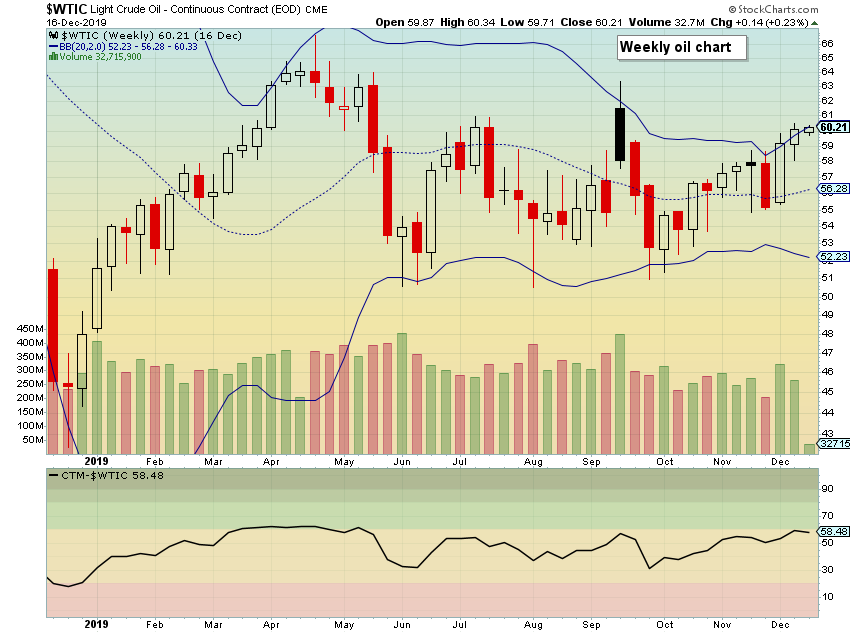
Next, weekly prices have been pushing against the upper Bollinger Bands for a few weeks. The Chande Trend Meter measures the strength of a trend based on different technical indicators and time frames.
The Chande Trend Meter (CTM), developed by Tushar Chande, assigns a numerical score to a stock or other security, based on several different technical indicators covering six different timeframes. Distilling all this technical information down into a single number provides an easy way to identify the strength of the trend for a given security. From Stockcharts.com:
As we can see from the chart, the advancement of this indicator is waning.

Last, we looked at the end of December volatility changes. Seventy percent of the time over the past ten years, volatility increased near the end of December.

Oil has had a tremendous advance so far in December and is coming into some resistance areas. Historically, January shows higher volatility, which could translate into lower prices for oil. We’ll have to see how it plays out, but for now, bulls should be cautious.

