How Math and Popping Corn (Futures) Relate

Ingredients:  Short corn futures & average daily contracts traded

Funds are short corn futures in a record amount according to the Commitment of Traders report that is released on a weekly basis.  RCM Alternatives end of day agricultural update on April 24th stated: “Managed funds continue to be willing sellers with the net position likely in the 350-400k range now”.

As a corn trader, those numbers stood out to me and I wanted to do a little more digging. I’ve been in the market long enough to see what happens when traders are forced to cover their shorts. I wanted to find out what type of volume the record short numbers translate into regarding daily volume activity.

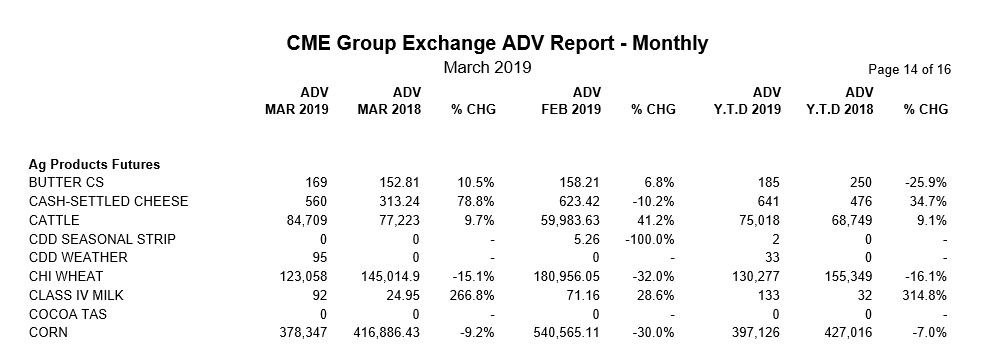
Looking at monthly volume data from the CME Group, we can see that corn in March 2019 (last row in chart below) had an Average Daily Volume (ADV) of 378,347 and February an ADV of 540,565 contracts. The year to date ADV was 397,126 through the end of March.

Taking a look at April 24th’s daily volume that the CME Group reports, we see that the one-day volume was 688,720 futures.

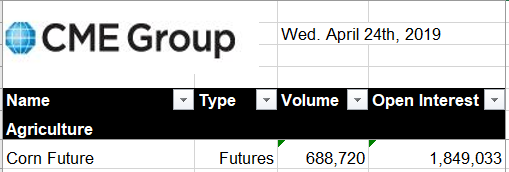
Comparing the current short position along with ADV, the current shorts are equivalent to approximately 1 full day of volume if using the March or YTD numbers. If using April 24th as a base, then the shorts are over 50% of the volume.  To me, that stands out. When the market goes against positions quickly and shorts are forced to cover (margin calls or just to stop their losses), the speed of the movement is amazing to watch.  Shorts cover, electronic systems flip to the other side, and it’s a whirlwind of activity, resulting in huge price moves for the day.

You likely know the saying “history repeats”. As a technical analyst, the training is learning historical price patterns and learning from past market movements. Each year brings its own set of circumstances, but a chart is still a chart. Comparing the corn chart from last year to this year, we can see a very similar chart pattern where corn declined 6.6%, followed by a one-day pop of 14 cents in March/April 2018. This year we had a 7% decline and are sitting at a level of multiple prior lows, testing support.

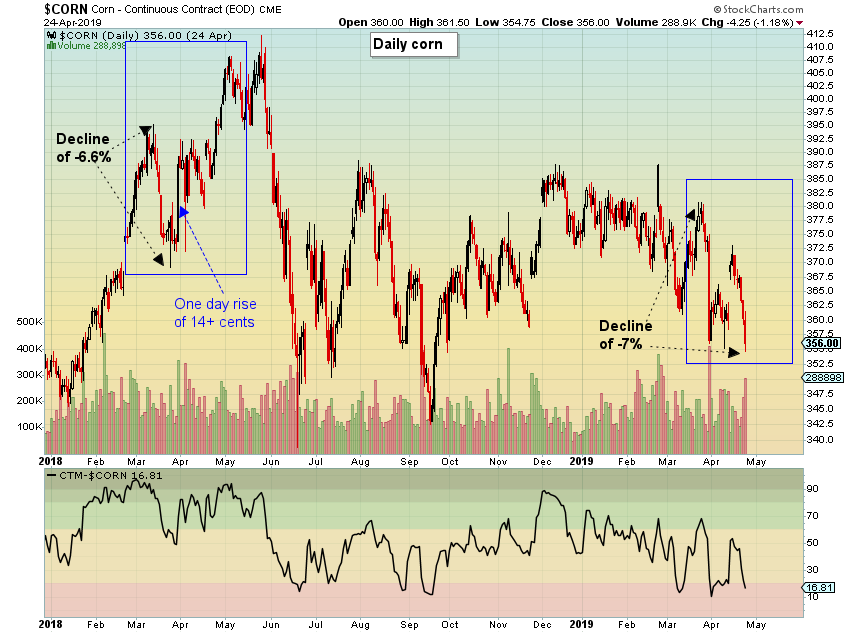
I also understand that the chart looks like a falling knife. However, when adding the ingredients together, I have an upward bias on corn for a potential pop. I think it’s just a matter of time waiting for the oil to heat up.

Disclosure: I am an active trader in the corn options and futures markets and currently have a biased bullish position in corn.

The post How Math and Popping Corn (Futures) Relate appeared first on Catalyst Hedged Commodity Strategy Fund Blog.

Latest

Small Cap Catch-Up: Market Reset?

This week marks the beginning of a significant earnings season, with reports expected from several major companies including NFLX, ASML, JNJ, BA, MS, UNH, TSM, and GS.

June Retail Sales Report Leads to More Questions

Today's retail sales release has us scratching our heads. The...

June HANDLS Monthly Report: Summer Heat

The graph and table above provide return data for...

The Fed is Fighting Yesterday’s Problem & Creating Tomorrow’s Economic Challenge

While the first quarter's CPI prints this year were above expectations, one needs to 'look under the hood' to have a better view on inflation (where it was and where it is going).

Newsletter

Don't miss

Small Cap Catch-Up: Market Reset?

This week marks the beginning of a significant earnings season, with reports expected from several major companies including NFLX, ASML, JNJ, BA, MS, UNH, TSM, and GS.

June Retail Sales Report Leads to More Questions

Today's retail sales release has us scratching our heads. The...

June HANDLS Monthly Report: Summer Heat

The graph and table above provide return data for...

The Fed is Fighting Yesterday’s Problem & Creating Tomorrow’s Economic Challenge

While the first quarter's CPI prints this year were above expectations, one needs to 'look under the hood' to have a better view on inflation (where it was and where it is going).

Monetary Policy Is Increasing The Deficit

Last week the Congressional Budget Office (CBO) released their latest ten-year budget projection. Significant deterioration in our fiscal outlook is visible with every release.
Kimberly Rios, CFA, CMT, Portfolio Manager
Kimberly Rios joined Catalyst Capital Advisors as a Portfolio Manager in 2014. She is currently a Portfolio Manager of an options-based commodity fund at Catalyst Funds. She carries the Series 3 license, the Chartered Financial Analyst (CFA) Designation, the Chartered Market Technician (CMT) designation, and is a member of the National Futures Association. Ms. Rios has degrees in Economics and Finance from the University of Arizona.

Small Cap Catch-Up: Market Reset?

This week marks the beginning of a significant earnings season, with reports expected from several major companies including NFLX, ASML, JNJ, BA, MS, UNH, TSM, and GS.

June Retail Sales Report Leads to More Questions

Today's retail sales release has us scratching our heads. The posted number showed strong retail sales for the month of June (ex-autos) with the control...

June HANDLS Monthly Report: Summer Heat

The graph and table above provide return data for major income-oriented asset categories for the month of June 2024 and YTD 2024. Returns for...