

Gold bugs have had quite a year so far. After years of consolidation, the price of gold moved over 20% from January 1, 2019 to its peak in early September. Most of those gains have stayed. However, during the past seven trading days, gold has fallen 4.8%, or $73, including few daily declines of $25 or more. With declines like that and gold off 7% from its high less than three months ago, it’s a good time to look at the charts for signs of supports and resistances, including the following:
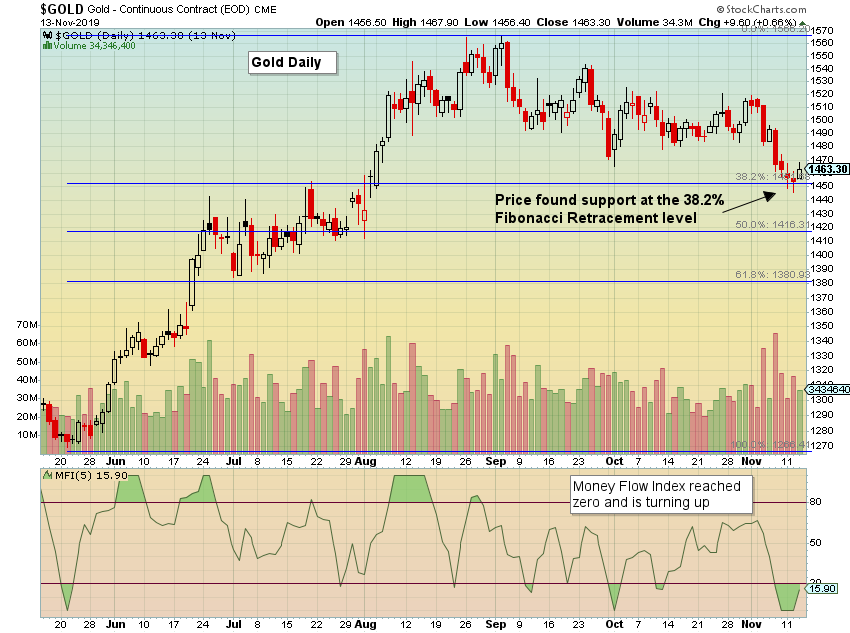
- Fibonacci Retracement Levels and Money Flow
- Bollinger Bands and Oscillators
- Trendlines and Volume
In the first chart, I’ve drawn Fibonacci Retracement levels from the price move starting the end of May to the high in early September. The first Fibonacci level of a 38.2% retracement comes in around $1,450. This week price was able to trade below it, however not close underneath that level. This level acting as support is fairly expected, as the Fibonacci Retracement levels are considered support (or resistance) areas. The Money Flow Index (lower part of chart) reached zero and is now turning upward and price has risen off the recent low.
The second chart reviews the stretch of the two standard deviation Bollinger Bands and the oversold oscillators. The price decline of $73 brought price from the upper band into the lower band in just seven days. Price finally closed above the lower Bollinger Band. The oscillators of Commodity Channel Index (CCI) and Slow Stochastics entered their oversold territories and have turned upward. The Relative Strength Index (RSI) was able to touch its oversold like at 30, an area which hasn’t been seen since mid-April.

Last, as price bounces from the support, a first area of resistance stands out. It’s where the trendlines from the price tops meet the old support around $1,480 (in green on chart). The selling volume has also declined since the two large down days during the earlier part of the move.

In summary, gold’s recent price move found at least a short-term support and oscillators became oversold. There has been a bounce in the price of gold off the September 12 low. A reasonable first target could be the resistance seen around $1,480. So far, all of the information I’ve reviewed leans toward a bullish argument. However, there are also some factors in the charts that I do not think should be ignored, including the following:
- Oscillators have turned upward, however, I’d prefer to see a “divergence” between price and oscillators. If price were to make a double bottom, yet oscillators made a higher low, then divergence would be present and a bullish stance would have more strength.
- Only the first Fibonacci Level was tested.
- The lower trendline in chart 3 exists.
- A -7% loss in three months can be hard to hold. Any long gold positions purchased after early August when price broke above $1,450, are currently underwater. If gold does bounce to a level where people want to exit without a loss (or only a small loss), that could result in more selling.
Either case, whether or a bull or bear, gold has provided a nice trading range and swings for investors and traders this year, including gains still present if one entered in the first two quarters. Knowing where levels of support and resistance are at can be useful. It will be interesting to see how gold plays out through the end of the year. Best of luck (and skill).