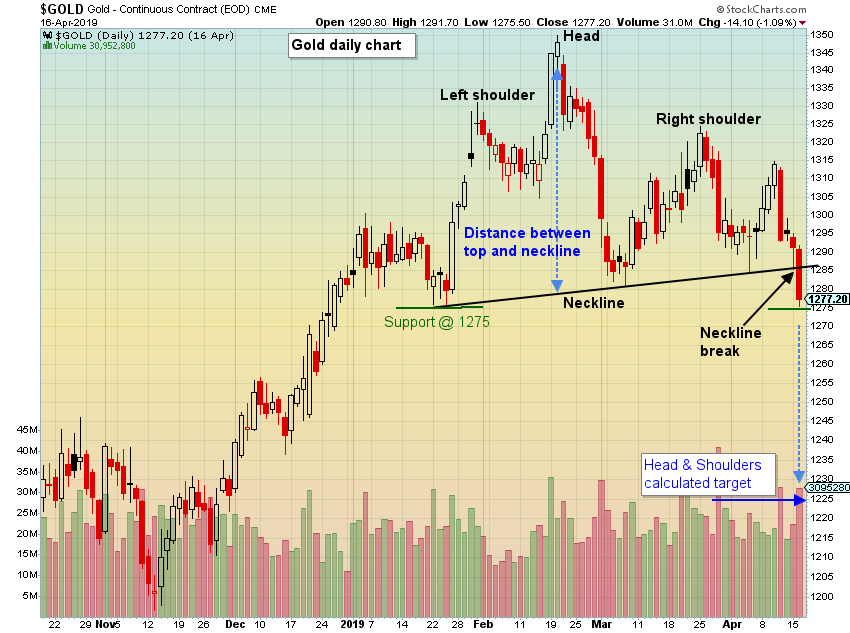
I have heard more and more discussion about the head and shoulders pattern that has formed on the gold daily chart. The talk usually ends with “if the neckline breaks, lower prices can be seen”. In technical analysis, one can actually calculate the expected price target of a head and shoulders pattern. I will walk through the calculation below and demonstrate the meaningful points on the current gold chart.
Stockcharts.com’s definition of a Head and Shoulders top is as follows:
“A Head and Shoulders reversal pattern forms after an uptrend, and its completion marks a trend reversal. The pattern contains three successive peaks, with the middle peak (head) being the highest and the two outside peaks (shoulders) being low and roughly equal. The reaction lows of each peak can be connected to form support, or a neckline. “
A brief explanation of the calculation is taking the distance between the head and neckline, then subtracting that distance from where the neckline breaks. In the current chart,
- The low of the “head” candle (the peak area) is approx. 1340 and with the “neckline” directly below the head being near 1279. This makes a distance of 1340 -1279 = 61 points (dollars in gold).
- The neckline where price broke through is just about 1285 (far right side of chart) where the black line acts as support below the lows, thus being the neckline.
- Subtracting the distance from the neckline break location, gives a target of 1285 – 61 = 1224.
How often the head and shoulders pattern follows through with the downside movement toward its target would be a topic for another post. However, in the current situation it should be noted that there is meaningful support right around 1275, where it is currently trading. Even though the neckline has broken (quite strongly), waiting to see if 1275 breaks would be prudent if trying to trade the head and shoulders pattern.

In summary, a simple calculation on the head and shoulders pattern results in an expected target near 1225. The support level to watch at 1275 was also noted. Looking back at the quick advance in December, it’s visible how a breakdown could occur quickly without much support along the way. It will be interesting to watch this play out.
The post Gold’s Head & Shoulders Price Target Calculated appeared first on Catalyst Hedged Commodity Strategy Fund Blog.

