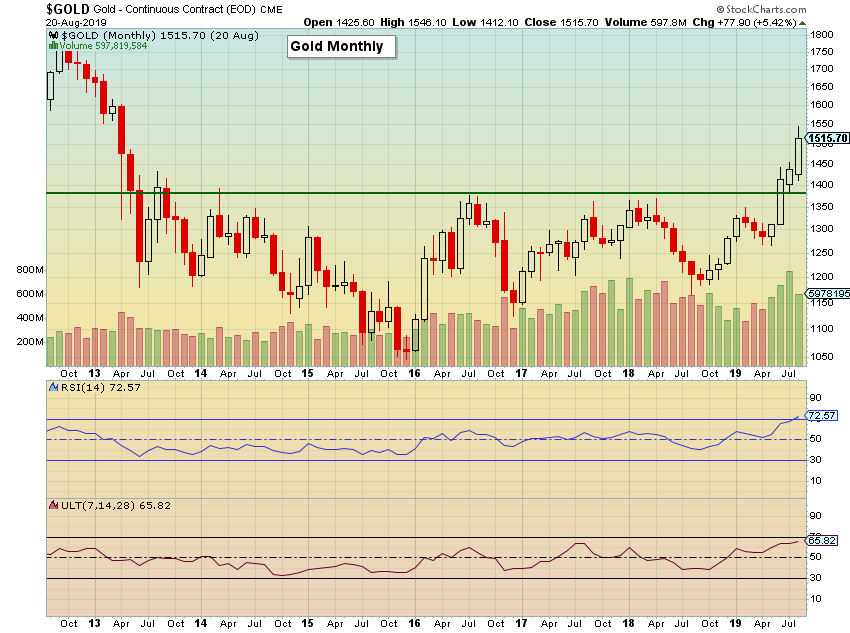
The yellow metal gold has received much attention lately after being “neglected” for so many years. Gold’s advance has reached the highest closing price since 2013. Multiple factors can attribute to the rise: central banks buying gold; a shift to safer assets fearing a global slowdown; uncertainty with the trade war; and the lowering of interest rates—just to name a few. Visually, one can see on the monthly chart just how powerful this advance has been. There are bullish candlesticks, increasing volume into the move, and the Relative Strength Index (RSI) and Ultimate Oscillator are at their highest levels in years.

Trendlines have moved higher and there are wide ranges between lines due to the breakout. A resistance line from last year has now turned into a support line near 1500. Additional meaningful supports are quite a bit lower.

There are solid reasons for gold’s price climb higher. Add another possible interest rate cut, and that should fuel gold even further. However, one can use the charts to act as a devil’s advocate to higher prices. A few things one can note on the charts:
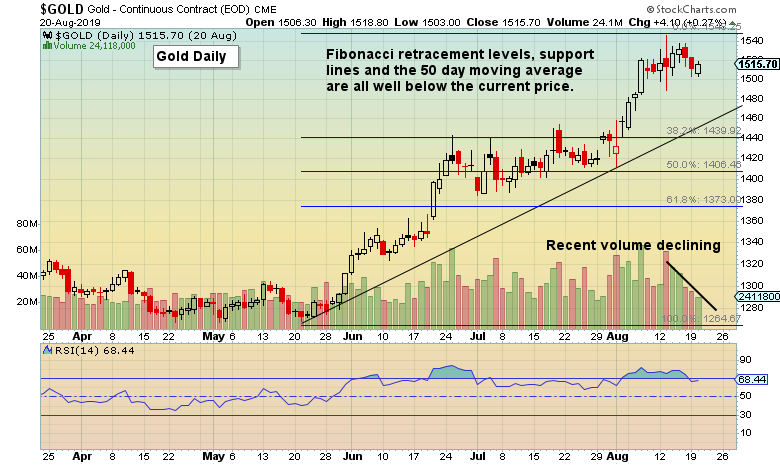
- Recently, gold’s volume and volatility have been declining. The chart below shows a volume peak around August 12, with sharp declines since.
- Consolidation occurred on the way up without much of a retracement. When drawing the Fibonacci Retracement levels from where the nearly $300-dollar advance started three months ago, the first Fib level of support is at $1,439, quite a distance below the current price and it’s also the top of that consolidation level, so a respectable support.
- The diagonal support line from mid-May is currently around $1,460, again far below current prices.
- RSI has been overbought for nearly all of August and has recently come off its highs.

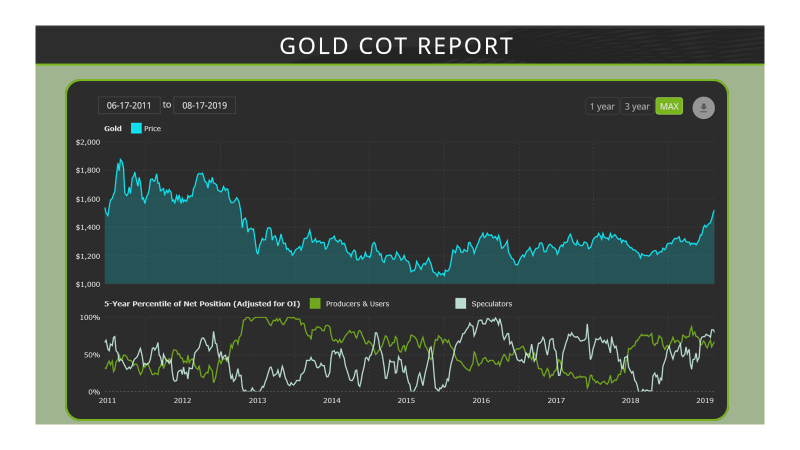
- Last, the Commitment of Traders report is showing speculators holding long a high level of contracts which increased during this move, while producers and users have been reducing positions (chart from FreeCoTData.com). Gold producers and users are actually short over -300,000 contracts. The last time shorts were near this level was summer 2016, which did not play out well for gold prices that fall.

As we await information from the Federal Reserve’s (Fed) minutes this week and the Fed Chair’s speech at Jackson Hole on Friday, gold’s volatility is still in the mid-teens, which is relatively high. I expect wide price swings will be seen before the weekend. After all is settled, my thoughts are that if gold cannot close respectably above $1,550 after all the news, lower prices in mid-high $1,400’s should not be a surprise.
Disclosure: Author hold both long and short positions in gold including related products & derivatives.

