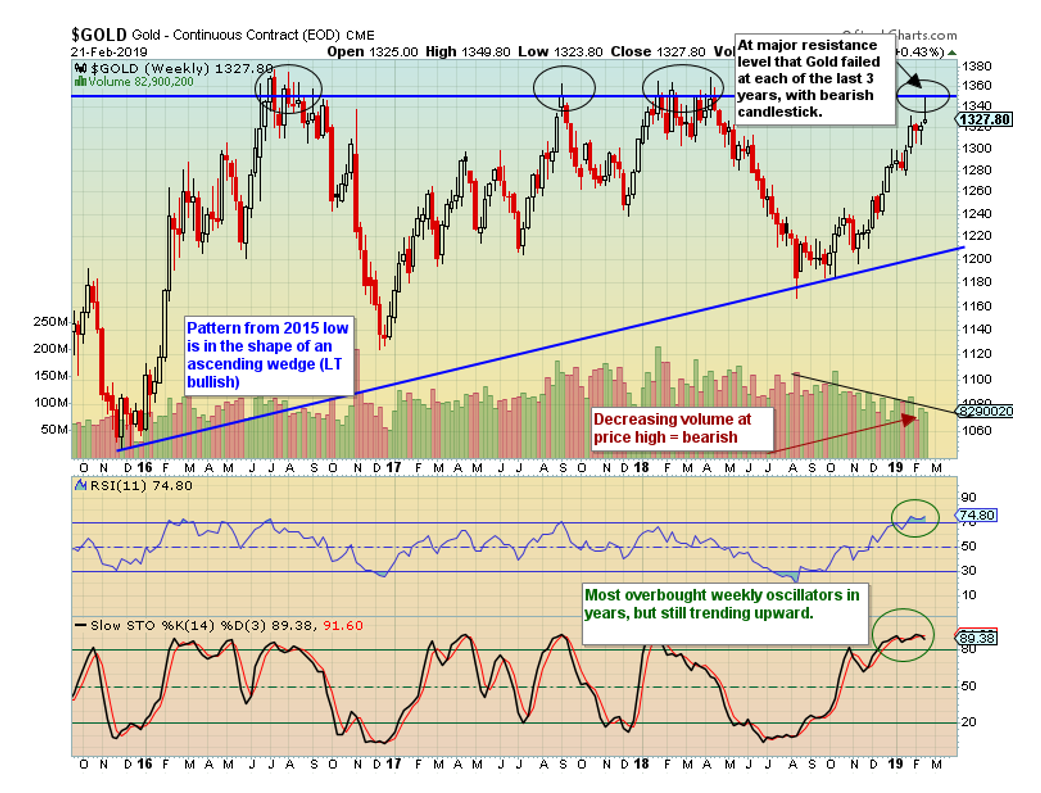
Gold has increasingly been in the news lately, after quite some time of little interest for the metal. Besides Fed rate news, the US dollar correlation, and fund flows being factors to contemplate, we also look at technical and seasonality. Right about this time of year, gold tends to give back some of its gains from the past two months. The gold chart is of no surprise, both short and long-term.
Long term has a fundamental case with numerous factors that have been in the news lately. The charts also match a long-term story, as price action shows an ascending wedge starting back from late 2015, when gold was near $1050. We brought that line up to meet the lows of last year, making the bottom line of the triangle (blue angled line on chart). The upper, blue horizonal line is where tops have turned over the past few years. Technically, if price breaks and holds above this upper horizonal line, such a long-term pattern should not be ignored, and higher highs should be expected.
The short-term outlook looks much different. Price quickly ran to the round number of 1350, then pulled back sharply, leaving a bearish candlestick. The advance was on declining volume and the weekly oscillators are in overbought territory. Add the seasonality dip usually seen around this time of year, and a pullback with some consolidation won’t come as any surprise.

The post Gold Hits Resistance appeared first on Catalyst Hedged Commodity Strategy Fund Blog.

