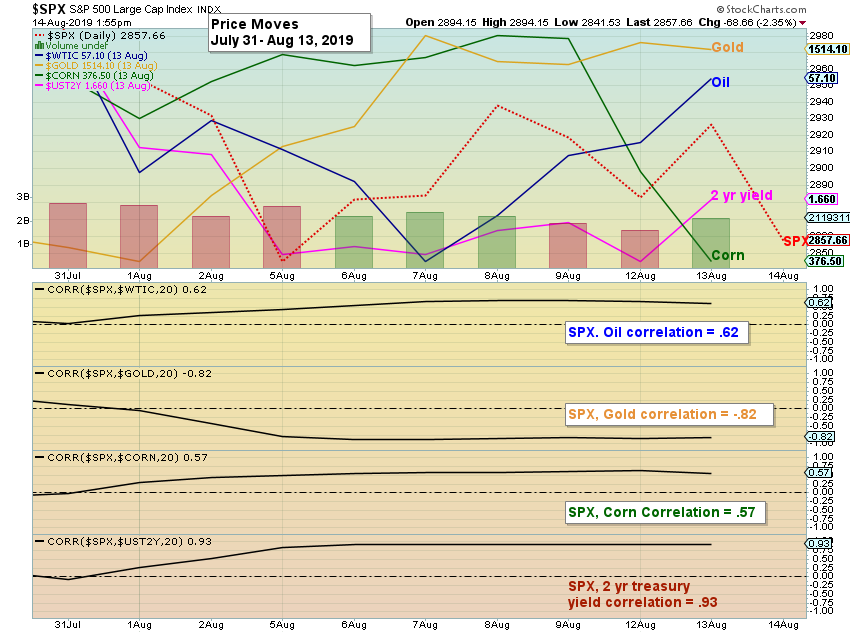
The markets have been whipsawing at break-neck speeds over the past two weeks, and the chaos is not isolated to equities. We viewed other sectors for comparison, and thought the findings may be of interest to others.
Between July 31 and Aug. 13, we looked at five markets for a broad representation:
- S&P 500 – Equities ($SPX)
- Crude Oil – Energy ($WTIC)
- Gold – Metals ($GOLD)
- Corn – Agriculture ($CORN)
- 2-Year Treasury Yield – Financials ($UST2Y)
The chart below has the closing prices on July 31, then the intraday high and low prices, the point range between the high and low prices, then the percent decline (or gain for gold) between the peaks.
| Close 7-31 | Intraday High | Intraday Low | Point Range | Hi-Low % Decline | ||
| S&P 500 | 2980 | 3017 | 2822 | 195 | -6.46% | |
| Oil | 58.58 | 58.82 | 50.52 | 8.3 | -14.11% | |
| Gold | 1438 | 1546 | 1412 | 134 | 9.49% | L to H |
| Corn | 410 | 425 | 376 | 49 | -11.53% | |
| 2 Year Treasury Yield | 1.89 | 1.89 | 1.58 | 0.31 | -16.40% |
Of the five products:
- Equities had the mildest percentage range of “only” -6.46%
- The 2-year yield had the largest range of -16.40%.
- Gold was the only product that gained (+9.49%)
Visually, the price graph below depicts just how erratic the moves have been. Correlations are below the price chart for demonstration. As expected, gold has had a -0.82 correlation with the S&P 500 Index since July 31. Oil and corn have had positive correlations of 0.62 and 0.57, respectively, and treasury yield are closely correlated with the S&P 500 Index movements.

Trading can be treacherous in these markets, but I’m sure some day traders are ecstatic with the volatility (and wondering why the VIX isn’t higher). The S&P is now into a double-digit streak of 1%+ intraday fluctuations. Sentiment Trader reported Monday that nine straight 1% intraday moves in stocks coming after a 52-week high has only happened three times since 1982. These are unique times. Participating in the action could be rewarding, treacherous, or a just blip on the radar for the long-term investor. Best of luck during these times, while we wait for something resembling “normal markets” to return.
*Note: tickers, prices and charts are from Stockcharts.com.

