Do the Crude Charts Match the News?

It’s hard to ignore all of the talk and articles about oil having a $100 target. That’s a significantly higher amount from where it trades now at roughly $72. The daily and weekly charts are filled with information. They can help guide in where resistance may be along with way as well as give other indications. A breakdown of the daily and weekly charts are below.

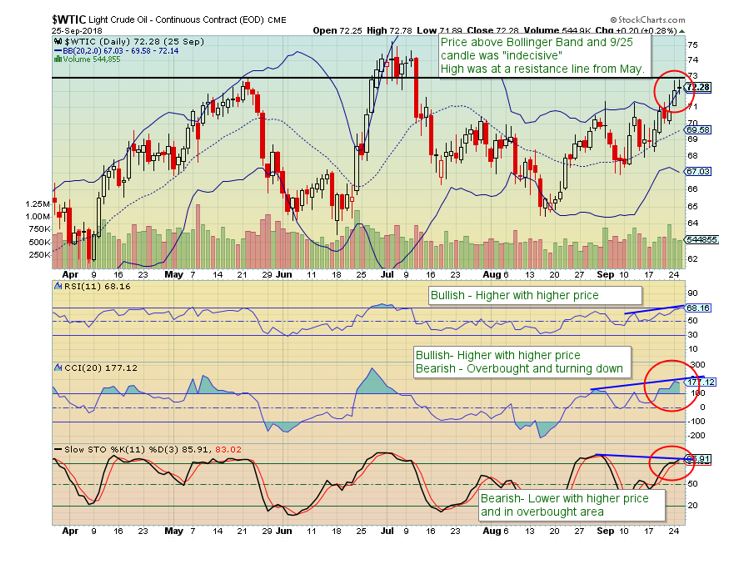
Daily Chart (as of 9/25/18)

-Price above Bollinger Band

-“Indecisive” candlestick after a 6.5% move in 5 days (low to high)

-Recent high is at resistance from May

-CCI and Slow Stochastics Oscillators in overbought territory

-RSI near overbought and at a high level overall

-Slow stochastics shows divergence – lower oscillator peaks with higher price peaks

-RSI and CCI have followed price – higher oscillator highs with higher prices

—These last 2 items are conflict with each other.

Weekly Chart

-Resistance level from 2011 & 2012 was recently touched and price retraced

-The 61.8% Fibonacci retracement level from the 2014-2016 move matches the above resistance line

-Volume has been decreasing on the move higher

-Oscillator divergence – Lower highs when price has been making higher highs

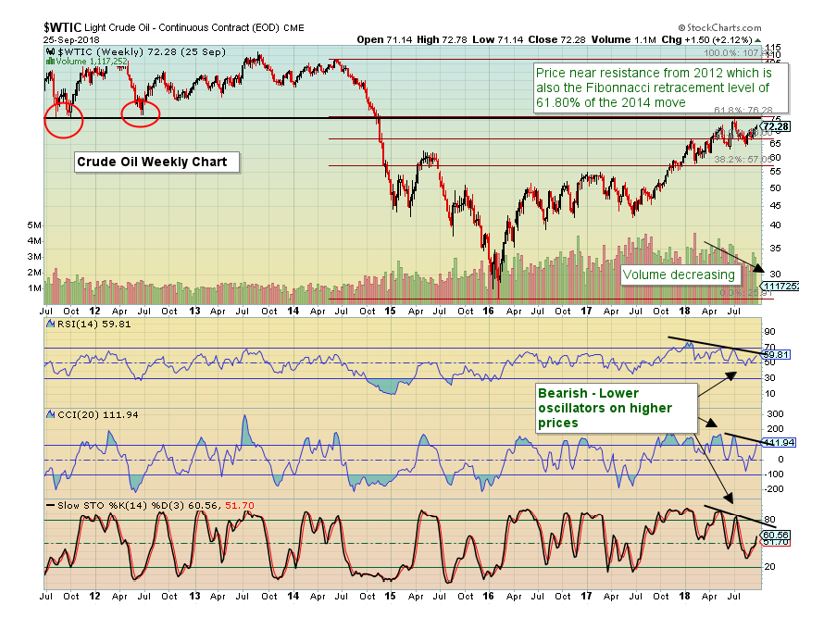
In summary, the daily chart has some conflicting items but shows the resistance line near $73. If this breaks and stays above, it’s time to revisit the charts for the next higher price targets. However when referring to the weekly chart, bearish signals are present.

The post Do the Crude Charts Match the News? appeared first on Catalyst Hedged Commodity Strategy Fund Blog.

Latest

Rate Cut Hype Fuels Growth: August 2025 HANDLS Monthly Report

Suffice to say, all of this reinforces a timeless investing principle: diversification pays off over the long haul.

How Leading Consumer Brands Have Emerged Stronger Since 2019

The last five years have been among the most intense stress tests in modern business history.

The Market’s “Lost” Moment: How Many Seasons Can This Rally Run?

For months, investors have been scaling what feels like an endless wall of worry. Each concern that gets resolved seems to spawn new uncertainties, yet the market has continued its relentless climb higher.

Can Markets Keep Their Cool? July 2025 HANDLS Monthly Report

Politics Trumps the Numbers, Can Markets Keep Their Cool?

Newsletter

Don't miss

Rate Cut Hype Fuels Growth: August 2025 HANDLS Monthly Report

Suffice to say, all of this reinforces a timeless investing principle: diversification pays off over the long haul.

How Leading Consumer Brands Have Emerged Stronger Since 2019

The last five years have been among the most intense stress tests in modern business history.

The Market’s “Lost” Moment: How Many Seasons Can This Rally Run?

For months, investors have been scaling what feels like an endless wall of worry. Each concern that gets resolved seems to spawn new uncertainties, yet the market has continued its relentless climb higher.

Can Markets Keep Their Cool? July 2025 HANDLS Monthly Report

Politics Trumps the Numbers, Can Markets Keep Their Cool?

The Calm Before the Storm: A Volatility Pro’s Reflection on Markets at All-Time Highs

We’ve lived this movie before. Last August, AAII bullish sentiment struck a 52-week high right before the Fed launched its September rate cutting cycle.
Kimberly Rios, CFA, CMT, Portfolio Manager
Kimberly Rios joined Catalyst Capital Advisors as a Portfolio Manager in 2014. She is currently a Portfolio Manager of an options-based commodity fund at Catalyst Funds. She carries the Series 3 license, the Chartered Financial Analyst (CFA) Designation, the Chartered Market Technician (CMT) designation, and is a member of the National Futures Association. Ms. Rios has degrees in Economics and Finance from the University of Arizona.

Rate Cut Hype Fuels Growth: August 2025 HANDLS Monthly Report

Suffice to say, all of this reinforces a timeless investing principle: diversification pays off over the long haul.

How Leading Consumer Brands Have Emerged Stronger Since 2019

The last five years have been among the most intense stress tests in modern business history.

The Market’s “Lost” Moment: How Many Seasons Can This Rally Run?

For months, investors have been scaling what feels like an endless wall of worry. Each concern that gets resolved seems to spawn new uncertainties, yet the market has continued its relentless climb higher.