Corn’s Price Chart Near Technical Apex Before USDA Report

Traders are anxiously awaiting Friday’s USDA’s numbers. Available data was lacking when the government was shut down, and on Friday the Crop Production and the USDA Supply/Demand report will be released.

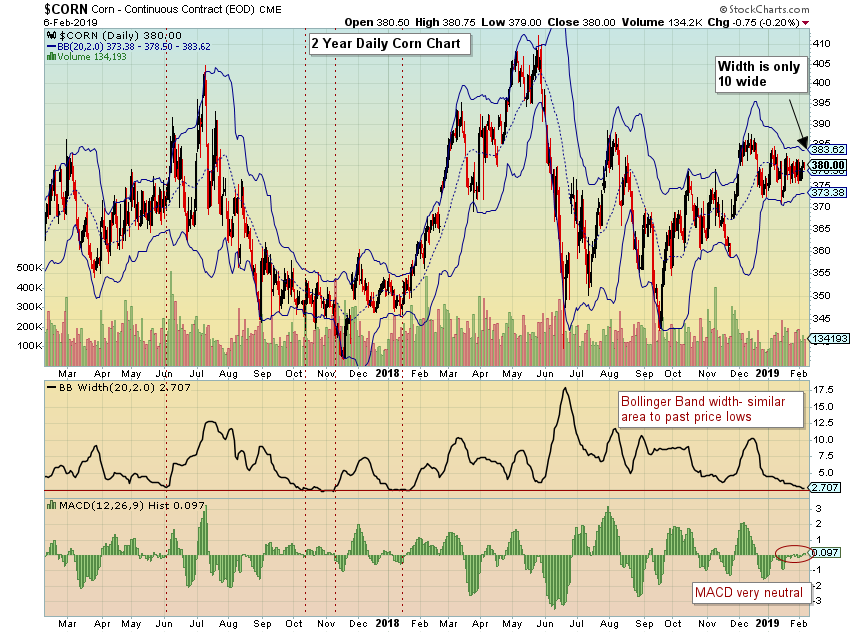
The corn price chart is tightly coiled. In a Bloomberg report last week, they stated “On a 24-month basis, prices are the most compressed in 54 years.”  The entire ranges this year for corn futures are only 13 wide on price, and currently 10 wide on Bollinger Bands.  As seen in the 2-year chart below, the last few times the BB Width has been at this level or lower, price typically advanced in the near future.
As expected, oscillators have not been very helpful during this price congestion.  There is a price pattern that stands out though.  The daily chart shows a pennant that is closing in on its apex.  One would think a breakout would have occurred by now, however Friday’s data release is the biggest we’ve had all year, so it’s not surprising that prices are still congested.

To obtain a target from a pennant breakout move, take the height of the pennant, then add and/or subtract that from where a breakout could occur. If we take the height of 19, you’d add and subtract that to the pennant lines from today’s date.  See chart.

The targets become:

Above:  399 target = 19 + 380

Below:  357 target = 19 – 376
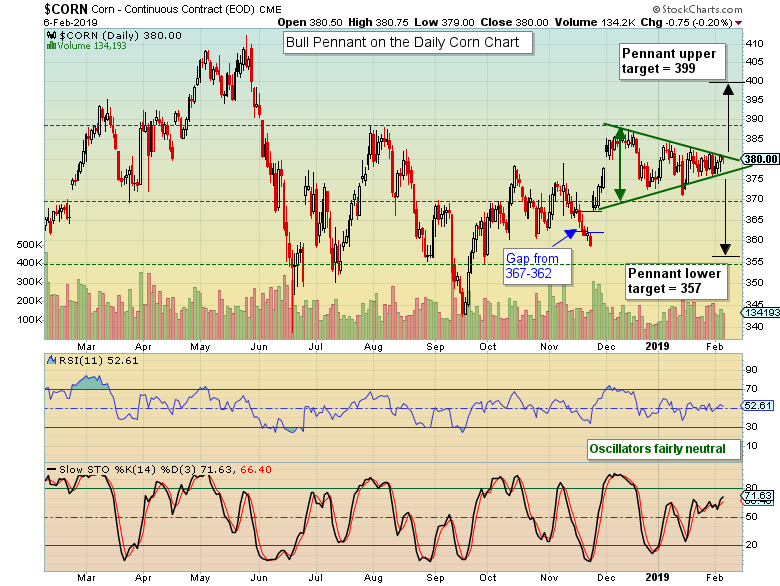
Last, I’ve added previous support and resistance lines to reference (dotted green), and the gap between 367 & 362, which could all be potential turning or “pause” areas.   I’ve heard a lot of talk about corn’s big move that is brewing. It’s just a matter of which way it will break out.   Best of luck this week if you’re trading corn.

The post Corn’s Price Chart Near Technical Apex Before USDA Report appeared first on Catalyst Hedged Commodity Strategy Fund Blog.

Latest

Navigating the Rate Cut: A Guide for Advisors

Introduction The ongoing Federal Reserve cycle has sparked intense debate...

My 50-Cents – Fed Analysis from Leland Abrams of Wynkoop, LLC

The Federal Reserve Board cut their benchmark rate this...

A Summer Surge: August 2024 HANDLS Monthly Report

After a challenging July that saw investors sell off high-flying technology stocks, buyers returned to the market in August, bidding up risk assets across the board.

Where are the Hidden Risks in Your Portfolio Currently? Plus, an idea.

Allocators add new exposures for a variety of reasons; diversification, returns, risk mitigation, etc. Understanding this, what is the most over-owned and expensive sector today?

Newsletter

Don't miss

Navigating the Rate Cut: A Guide for Advisors

Introduction The ongoing Federal Reserve cycle has sparked intense debate...

My 50-Cents – Fed Analysis from Leland Abrams of Wynkoop, LLC

The Federal Reserve Board cut their benchmark rate this...

A Summer Surge: August 2024 HANDLS Monthly Report

After a challenging July that saw investors sell off high-flying technology stocks, buyers returned to the market in August, bidding up risk assets across the board.

Where are the Hidden Risks in Your Portfolio Currently? Plus, an idea.

Allocators add new exposures for a variety of reasons; diversification, returns, risk mitigation, etc. Understanding this, what is the most over-owned and expensive sector today?

Consumer Spending: Are Consumers Tapped Out or Pushing Back?

Consumer Spending: Are Consumers Tapped Out or Pushing Back?  Key...
Kimberly Rios, CFA, CMT, Portfolio Manager
Kimberly Rios joined Catalyst Capital Advisors as a Portfolio Manager in 2014. She is currently a Portfolio Manager of an options-based commodity fund at Catalyst Funds. She carries the Series 3 license, the Chartered Financial Analyst (CFA) Designation, the Chartered Market Technician (CMT) designation, and is a member of the National Futures Association. Ms. Rios has degrees in Economics and Finance from the University of Arizona.

Navigating the Rate Cut: A Guide for Advisors

Introduction The ongoing Federal Reserve cycle has sparked intense debate regarding its resemblance to the 2007 and 1998 financial crises. While a definitive answer remains...

My 50-Cents – Fed Analysis from Leland Abrams of Wynkoop, LLC

The Federal Reserve Board cut their benchmark rate this week by 50 bps to a new range of 4.75% - 5.00%.  They indicated this...

A Summer Surge: August 2024 HANDLS Monthly Report

After a challenging July that saw investors sell off high-flying technology stocks, buyers returned to the market in August, bidding up risk assets across the board.